This is the second in a two-part series related to the analysis of wood baskets and timber markets for investments in forest industry mills, wood-using bioenergy projects and timberland.
Part I of Wood Market Realities (Stumpage Price Paranoia) addressed real and perceived issues associated with stumpage price data and forecasts. The “paranoia” emphasizes the need to kick the tires on stumpage price data sets and the value of recognizing stumpage forecasts as one piece of a complete analytic effort. Building a house requires more than a hammer. Successful analysts deploy a set of tools to measure (twice or more), test and analyze markets for wood and timberland (and everything else….)
Consider the question of wood demand. As a timberland investor, would you prioritize high volume markets (with lots of mills demanding lots of wood) or high utilization (where mills run at near capacity)? As a wood user looking to locate a new facility, which would you prioritize? Table 1 provides a snapshot of the disparity of wood demand for pine sawtimber (PST), utilization at PST-using mills and PST pricing across groups of states in the US South. [Please note: “utilization” as reported by the Wood Demand Report captures the ratio of actual raw material purchases in a quarter to the potential wood demand at full capacity. The ratio varies over time in part due to changes in mill inventories.]
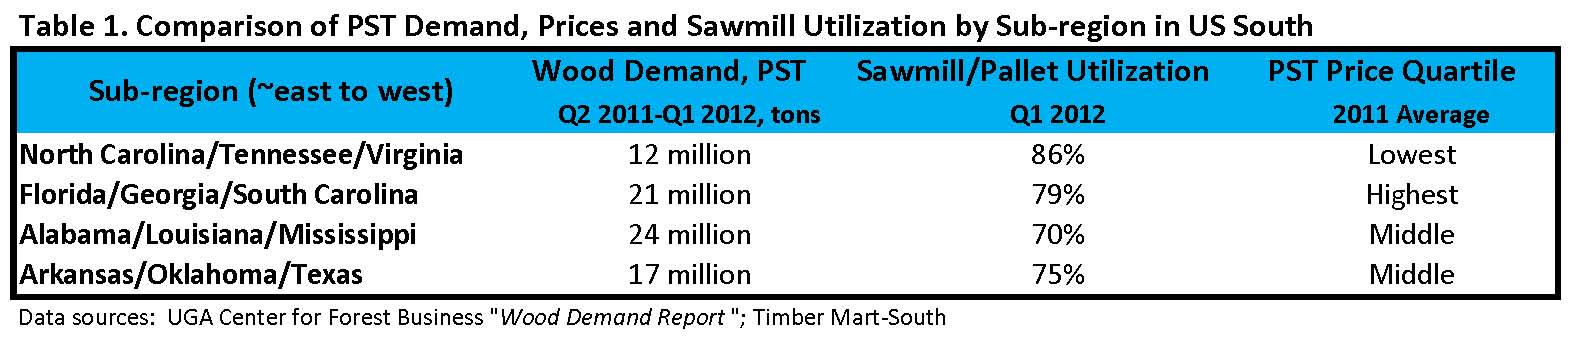
What can we learn or ask about pine sawtimber markets based on the comparisons in Table 1?
- Low demand is associated with lower prices, regardless utilization. We observe this across markets and forest product types. For both timberland investors and wood users, low volume markets correspond to high risk. Typically, demand trumps utilization when investigating wood raw materials.
- Demand, utilization and prices are all incomplete metrics when used independently. High demand (volume) can, at any given time, correspond with low, market level utilization, and vice versa. And high prices can easily correspond with low volume. Selling the highest priced sawlogs in the free world into a market that consumes seven tons per year is not a business; it’s a hobby.
- Timber market metrics temporarily and imperfectly quantify ambiguity. The Table 1 example generates questions of its own. What happens to the comparison if we include (pine sawtimber-using) plywood plants? What happens if we assess states individually or carve out firm or tract specific markets? How do these figures look over time?
Forisk will address specific data and analytic issues during “Timber Market Analysis” on August 15th in Atlanta, a one-day course for anyone who wants a step-by-step process to understand, track, and analyze the price, demand, supply, and competitive dynamics of local timber markets and wood baskets. For more information, click here.
Too simplistic. What about potential supply/wood availability and an inclusion of different types of end users in the region. These factors will have impact on the overall price picture.