Forest industry press covers the capital investments in mills, housing starts, lumber prices, and consolidation across the forest industry supply chain. The question then comes up with colleagues and clients: what are we missing? What topics, themes and drivers should we be more sensitive to? What could disrupt the industry? What asteroid, black swan or cataclysm should, could or might reorder our world? And how should we frame, screen and prioritize these disruptions, whether positive or negative?
This post is the first in a series to introduce and apply a simple framework to evaluate the implications on forestry from internal and external disruptions ranging from technological advancements to legislative tinkering to economic contagions.
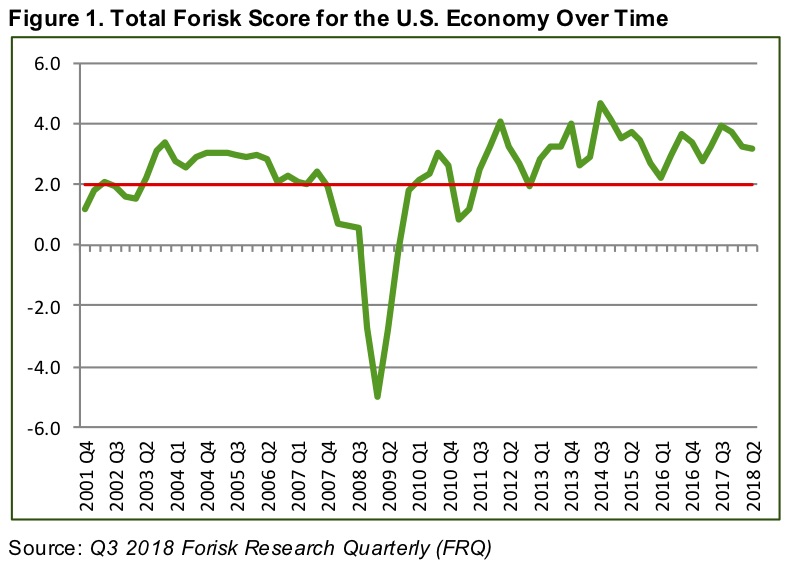
Current Situation
For the 22nd consecutive quarter as of Q3 2018, the Forisk Score, which provides a recent-weighted measure of the direction and health of the U.S. economy, remained above the “no growth” baseline of 2.0. Overall, variables associated with production, investment and prices indicate and support a story of economic growth. In particular, job growth remains strong. In Q2 2018, the U.S. generated its 31stconsecutive quarter (since Q4 2010) of positive job creation. Real GDP was positive for 28 of the past 29 quarters, or over seven years.
However, as economic growth continues, potential headwinds from inflation and capital costs increased. In Q2 2018, inflation increased year-over-year; CPI and PPI rose to 2.9% and 5.8%, respectively. Yields on 10-year U.S. Treasuries exceeded 3% in April and May in hitting a quarterly pace of 2.91%, its highest in over six years. In addition, over the last year, the yield curve for U.S. Treasuries has flattened, a traditional precursor to economic recessions.
Timberland Values
The relationship between U.S. Treasuries and discount rates drives discussions affecting timberland valuations. The quarterly data in Figure 2 covers 30 years, from Q1 1987 through Q2 2018. For the first five years, quarterly yields on 10-year bonds averaged 8.5%, while over most recent five years, yields averaged 2.3%. Meanwhile, timberland values increased on average in the U.S. from $600-700 per acre in the late 1980s to over $1,800 per acre today.

Timberland assets are constantly compared with alternative investment opportunities, and history reinforces the relationship between interest rates and valuations. If the core cash flows from an asset don’t change, lower discount (interest) rates support, lead to, cause and correlate with higher values, and vice versa.
Let’s be clear about the organizing principles here. First, timberlands (and mills) require capital. Second, investors have the capital. Third, investors have opportunity costs. If long-term U.S. Treasuries offered a 7% yield, net returns from alternate investments should exceed this. The cash flows and expected yield spinning off an asset justify the capital allocated to that asset. While legitimate reasons justify timberland ownership – diversification, hedging, ESG – increasing interest rates absent changes to cash flow generation increase pressure on valuations.
This leads to a tightening of the belt and sharpening of the pencil. If asset values and portfolios get squeezed by higher interest rates and investment plans have less margin for error, then they also have increased exposure to negative risks and disruptions and increased interest in performance enhancing opportunities.
The math of macroeconomic variables such as interest rates on hard, cash flow generating assets such as timberland represent a critical—and traditional—talking point for investment decisions. However, world events and shifting in capital markets increase our awareness and interest in the broader range of disruptions potentially relevant to forestry. How should we think about these?
We address this in Part II.
Am I missing something or not viewing Figure 1 correctly? I read 22 consecutive quarters above your 2.0 growth baseline. I see 5, possibly 6 quarters below the 2.0 growth baseline. Just an observation about how the data is graphed and how it is reported.
Gold, too, has increased substantially in nominal dollar value from about $400 in the early ‘80s to near $1200 today. As the value of the dollar has dropped over time, the value of hard assets such as gold and timberland has increased.
Mike,
I had the same question, but after a second look realized that 22 quarters takes you back to 2013Q2. The chart goes back much further.
Matt