This is the second in a three-part series related to Forisk’s modeling of future softwood stumpage prices in the US South and Pacific Northwest.
In Tony Hillerman’s Navajo Tribal police novel Dance Hall of the Dead, Lieutenant Joe Leaphorn remembers what mentor Hosteen Nashibitti told him. “When the dung beetle moves, know that something has moved it.” The lesson reinforced the interdependency of things; each movement has its reason, cause and effect. [Drum beat] And so it is with wood flows and stumpage prices. When wood moves, something has demanded it.
When forecasting stumpage prices, we care deeply about the sources of demand for pulpwood and softwood logs over time. In Part I of Forisk Forecast (Studying US Housing Starts), I outlined a view of the housing industry, a critical “macroeconomic” source of wood demand. In this post, I summarize at a regional level a critical “microeconomic” source of wood demand: the productive capacity of sawmills in local markets. In aggregate, localized clusters of softwood sawmills produce the lumber required to satisfy national demand from the housing sector. And these sawmills represent the primary source of sawlog demand and cash flows to timberland owners.
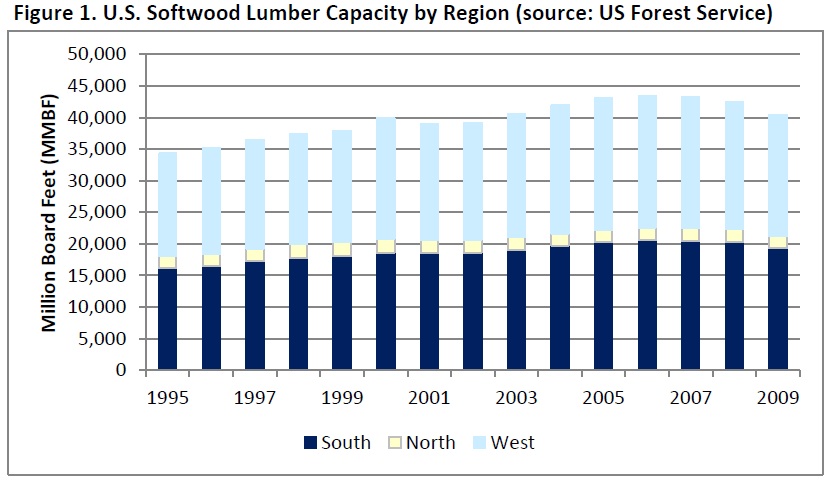
According to the U.S. Forest Service, total U.S. softwood lumber capacity peaked in 2006 (Figure 1). In the U.S South, softwood lumber capacity also peaked in 2006, hitting 20.6 billion board feet. When housing declined, the lumber industry “rationalized” capacity, increasing our stock of idled and closed sawmills. In the U.S. South, the number of mills declined by nearly one-third, from 440 in 1995 to fewer than 300 in 2011. This period also saw the industry move towards larger, more efficient sawmills.
 In modeling a given U.S. region, we might ask, “How does current lumber production in the South compare to current lumber capacity in the region?” According to the Southern Forest Products Association (SFPA), the U.S. South produced 13.61 billion board feet in 2011. According to Forisk analysis of the Forest Industry Shapefiles from the Center for Forest Business at the University of Georgia, the U.S. South has 16.7 billion board feet of open capacity and another 0.3 BBFT of idled capacity, for a total of 17 billion board feet. This implies a capacity utilization of 80%. This estimate falls in line with tracking of actual wood raw material consumption in the U.S. South. According to the Wood Demand Report, effective capacity utilization in the U.S. South at sawmills as of Q1 2012 was 77%.
Carrying this forward, we see that as housing starts “return to trend”, demand for softwood lumber will outstrip current capacity. This is also true in the U.S. West. Mitigating factors that affect the forecasting of issues such as “capacity constraints” include, for example, the ability of mills to run in excess of 100% by adding extra shifts and by the reopening of closed mills. And localized productive capacity and demand alter the trajectories of potential stumpage prices in different timber markets.
Part III addresses prices and localized stumpage forecasts.

Leave a Reply