No.
Let me explain.
On October 29th, 2012, Hurricane Sandy – crowned “Superstorm Sandy” by the media – landed on the East Coast of the United States, disrupting businesses from North Carolina to Maine and west to Michigan and Wisconsin, with concentrated damage in the Northeast. According to The Wall Street Journal, initial estimates of the insurable losses exceeded $15 billion with total damages falling between $30 and $50 billion (“Sandy’s insured-loss tab: up to $20 billion”, 11/2/2012). In response to multiple questions from investors and reporters about the potential effects on timber stocks, I conducted a simple “event study” to see if, in the short-term, we observed statistically “abnormal” moves in timber REIT stocks immediately before or after Sandy.
Testing the effects of Hurricane Sandy on the publicly-traded timberland-owning sector presents issues that complicate potential results:
- Our “event” hit the U.S. on October 29th, a Monday. Wall Street, in response, closed for trading on October 29th and October 30th, and reopened on October 31st. From a research standpoint, this gave investors a couple of days to sort things out (if that was possible in this case) and diminishes potential relevant price moves. (It also suggests a “long-term” event study may be worth revisiting several months from now….)
- There was this other “event” occurring around the same time: a U.S. Presidential Election. History suggests Presidential Elections affect trading activity, too….
- Pure manufacturers of building products, such as lumber and OSB, may show more direct effects in this type of post-catastrophe environment.
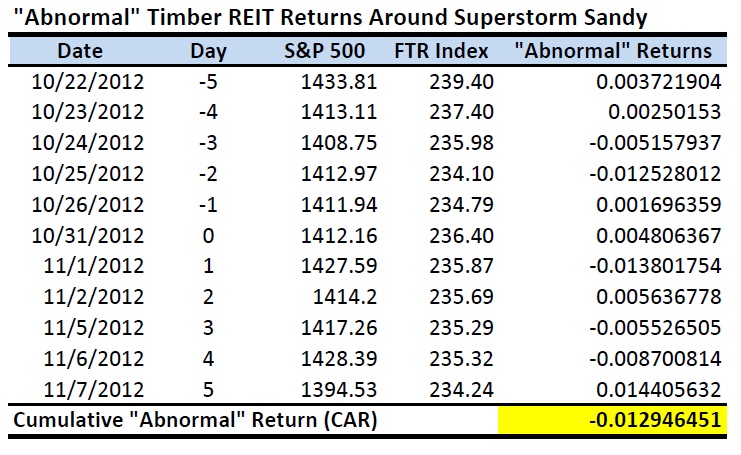
We used a simple regression to estimate the relationship between returns from the S&P 500, which represents the overall market, and the Forisk Timber REIT (FTR) Index, which represents the publicly-traded timber sector. Then we create an “event period” that frames when Sandy might impact timber REIT stock prices. For this short-term study, we used an eleven-day period starting five trading days before the event and ending five trading days after the event. The table below summarizes the results.
The estimated “Cumulative Abnormal Return” for the event window totaled -1.3%. For the five days following the event, the CAR totaled -0.8%. In sum, for this particular question and this particular timeframe, Sandy proved much ado about nothing.


Interesting. Nice one Forisk.
Loren