This is the fourth in a series related to the Q4 2018 Forisk Research Quarterly and Forisk’s annual “Wood Flows & Cash Flows” event on December 13th in Atlanta. This post includes an excerpt from the Q4 2018 Forisk Research Quarterly feature article, “Softwood Sawtimber Supplies in the U.S. Northwest and South: Implications for Investors” authored by Amanda Lang and Shawn Baker.
Supply influences timber prices, and these influences vary regionally and locally in U.S. timber markets. In the South, prices remain low in the face of surging demand while the West has higher prices in the face of constrained capacity. Supply inventory histories describe timber market personalities and help us tell stories about market changes. Log supply accumulation and future projections vary by state and market, so local stories can be quite different than regional trends, with different implications for investors.
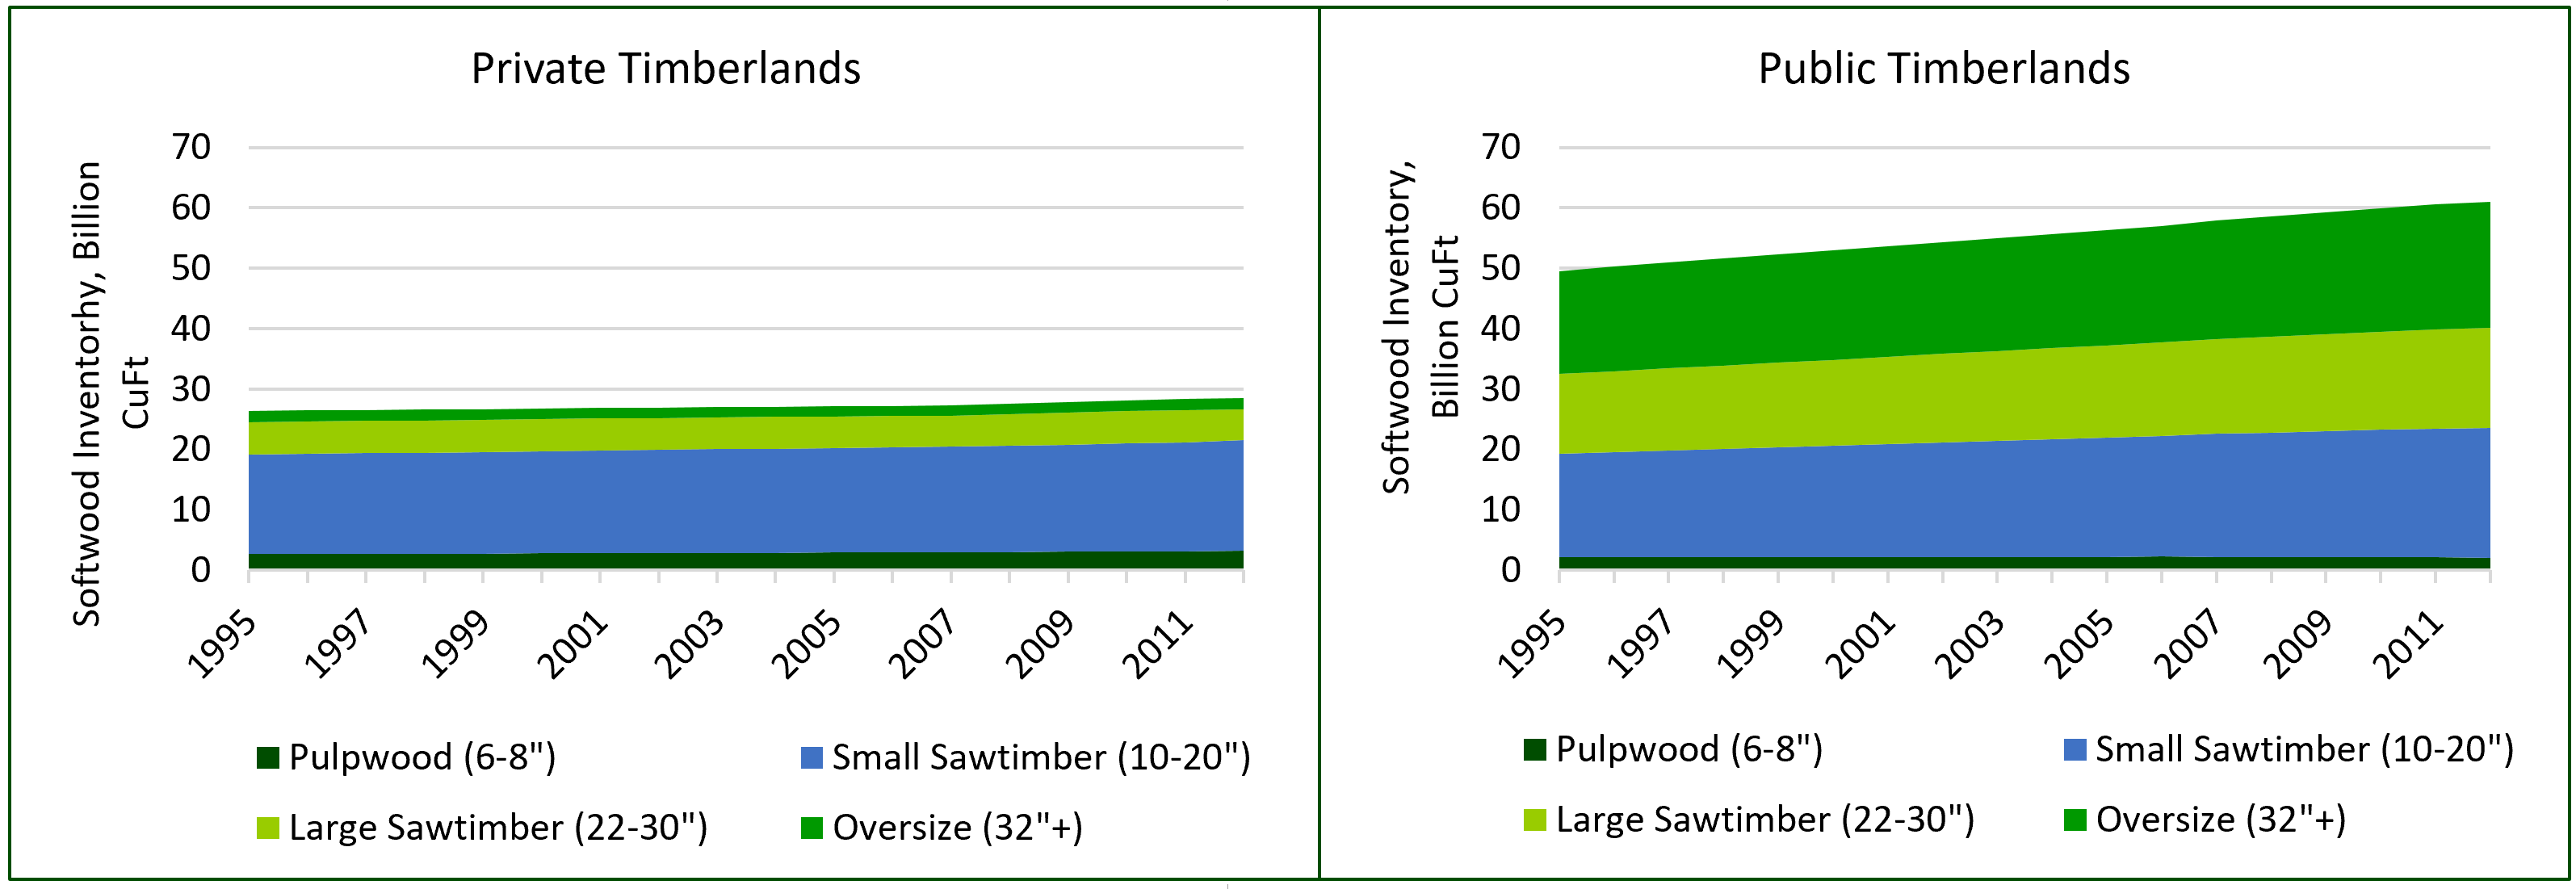
Historic inventories in the Pacific Northwest suggest that public lands accumulated supply rapidly, while timber inventories on private lands grew at a slower pace (Figure 1). Since 1995, the inventory of Douglas-fir and hemlock on private lands increased 10%. Critically, the “core” sawtimber size class from 10-20” increased 14% while large sawtimber inventories declined 7%. Public inventories, however, differ. With substantially lower harvest levels, volume continues to accumulate on public lands in the Northwest, particularly in larger size classes. The volume of smaller sawtimber remained more consistent and roughly equates to private inventories.
The Pacific Northwest is a small region relative to the U.S. South. Private timberland supplies make up 32% of the inventory and 80% of the removals. This dynamic keeps the inventory relatively flat with respect to removals. If harvesting were to increase on public lands in the region, this would shift towards massively more timber supply for mills or export. Unless that happens, the region will continue to be on a tight string between stable private supplies, mill demand, and export log demand.
Figure 1. Pacific Northwest Douglas-fir/Hemlock Inventory by Product Class, 1995-2012.

Source: US Forest Service FIA
In contrast, the U.S. South is dominated by private timber supplies. Private timberlands make up 88% of timberland in the region (versus public sources). Pine inventory on private timberlands increased 26% in the South from 2003 to 2013, and increased 35% since 1995.
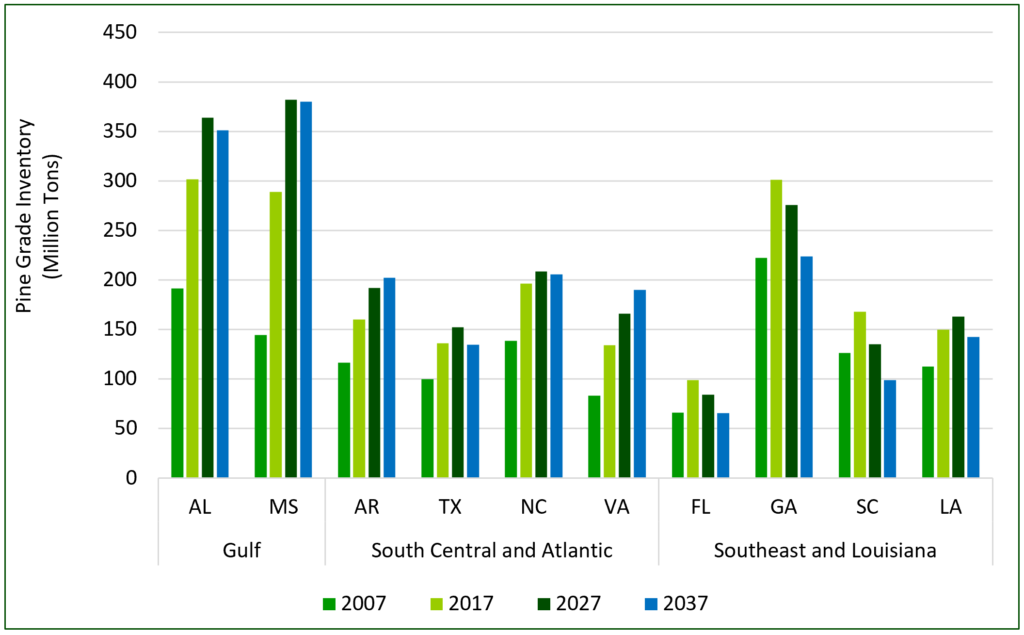
The growth in sawmill capacity across the region is finally affecting the relative supplies of sawtimber and the supply outlooks (Figure 2). In states such as Georgia, where strong demand growth comes with a number of new sawmill announcements, grade inventories forecast to decline over the next ten years and may approach 2007 inventory levels in 20 years. Other areas of the South continue to see appreciable volume accumulations, though, with less additional new demand. As a region, we forecast Southern softwood sawtimber inventories to increase 11% over the next ten years. While pine sawtimber supplies continue to grow through 2028, local state profiles vary. The Gulf states increase the most. Combined chip-n-saw, pine sawtimber, and large sawtimber inventories in Mississippi grow 41% by 2028, the most of any state, followed by Alabama with 25% growth. Volume in the South Central and Atlantic states increases moderately, while the Southeastern states project declines in pine sawtimber inventories. Inventories in these states remain above 2007 levels (pre-recession) despite ten-year declines.
Figure 2. Pine Sawtimber Inventories by State, 2007-2037 (CNS, PST, and LgPST)

Sources: Forisk, SOFAC, U.S. Forest Service
State-level forecasts of supply, demand, and pricing are diverging, and represent unique timber markets with different personalities. Despite this, the key for timberland investors and mill expansions centers on local dynamics.
Forisk thanks Dr. Bob Abt with SOFAC and Ray Sheffield for their assistance with this research.

Leave a Reply