In 2020, the U.S. economy has offered a bundle of mixed signals. Crashing growth and demand in Q2 led to a massive fiscal stimulus. Bullish stock indices and housing markets sit on uncertain labor markets. Even after tremendous growth in Q3, the economy remained ~3% smaller entering Q4 than it was in January. As investors and analysts, we struggle to look forward when the floor keeps moving.
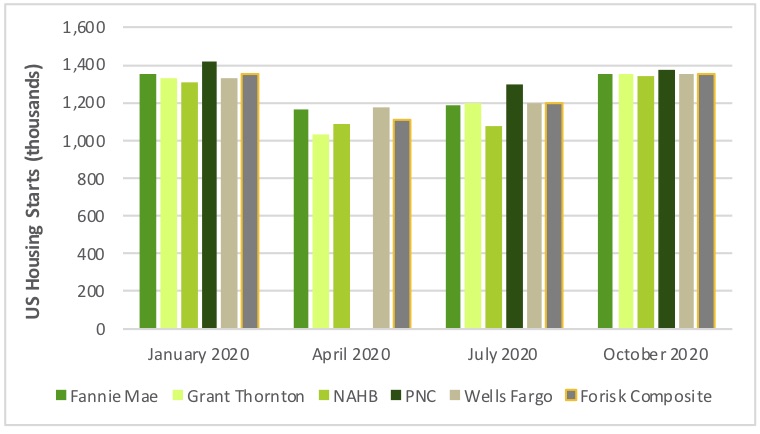
Consider how forecasts of U.S. housing markets changed throughout 2020. The figure below summarizes housing starts forecasts from multiple sources with Forisk’s Composite Outlook by quarter. We started 2020 expecting ~1.35 million housing starts and we’re ending 2020 expecting ~1.35 million, but we walked through the valley on the way. Consensus housing numbers fell ~17% from Q1 to Q2 and increased ~14% from Q3 to Q4. Like riding the big bowl in a skate park.
2020 Quarterly U.S. Housing Starts Forecasts by Source

The great explorers and navigators depended on the stars to fix their positions, even as their wandering barks rode the waves. In the forest industry, we rely on physical facts, associated with demographics and forest supplies and mill capacities, to set our models. We aggregate facts to identify trends and derive insights. In this way, we work to leverage data and logic to develop projections.
Finally, we keep track of our results to evaluate performance over time. Through back-testing, we learn to separate the driving factors from the noise in order to make the best use of our available data.
Click here to view the agenda and learn more about our annual “Wood Flows & Cash Flows” conference, held virtually on December 8th. In addition to guidance on the use of price forecasts and projections in the forest industry, topics include timberland investments, timber REITs, forest operations and the analysis and ranking of timber markets and wood baskets for investment applications.

Leave a Reply