This post includes data from Forisk’s Timberland Transactions Database and research from the Forisk Research Quarterly.
We recently reviewed timberland transaction volume going back to 2014. We noted that 2023 was a slow year with just over 1 million timberland acres transacting and presented a chart showing total acres traded by year along with the implied per acre value based on the NCREIF Timberland Index. Through Q2 2024 the trend continues, with transaction volume low (~450 K acres) and timberland values continuing to increase. While there remain a number of pending transactions and several recently announced packages, it would be surprising, at this point, if 2024 significantly outpaced 2023.
This begs the question as to whether any other metrics could provide insight with respect to the status of the market. One commonly touted benefit of timberland is its potential as an “inflation hedge.” With inflation trending down, might investors be inclined to reallocate away from timber?
The following chart shows annualized NCREIF returns (presented quarterly) compared to compounded annual rate of change for the Consumer Price Index, again presented quarterly.
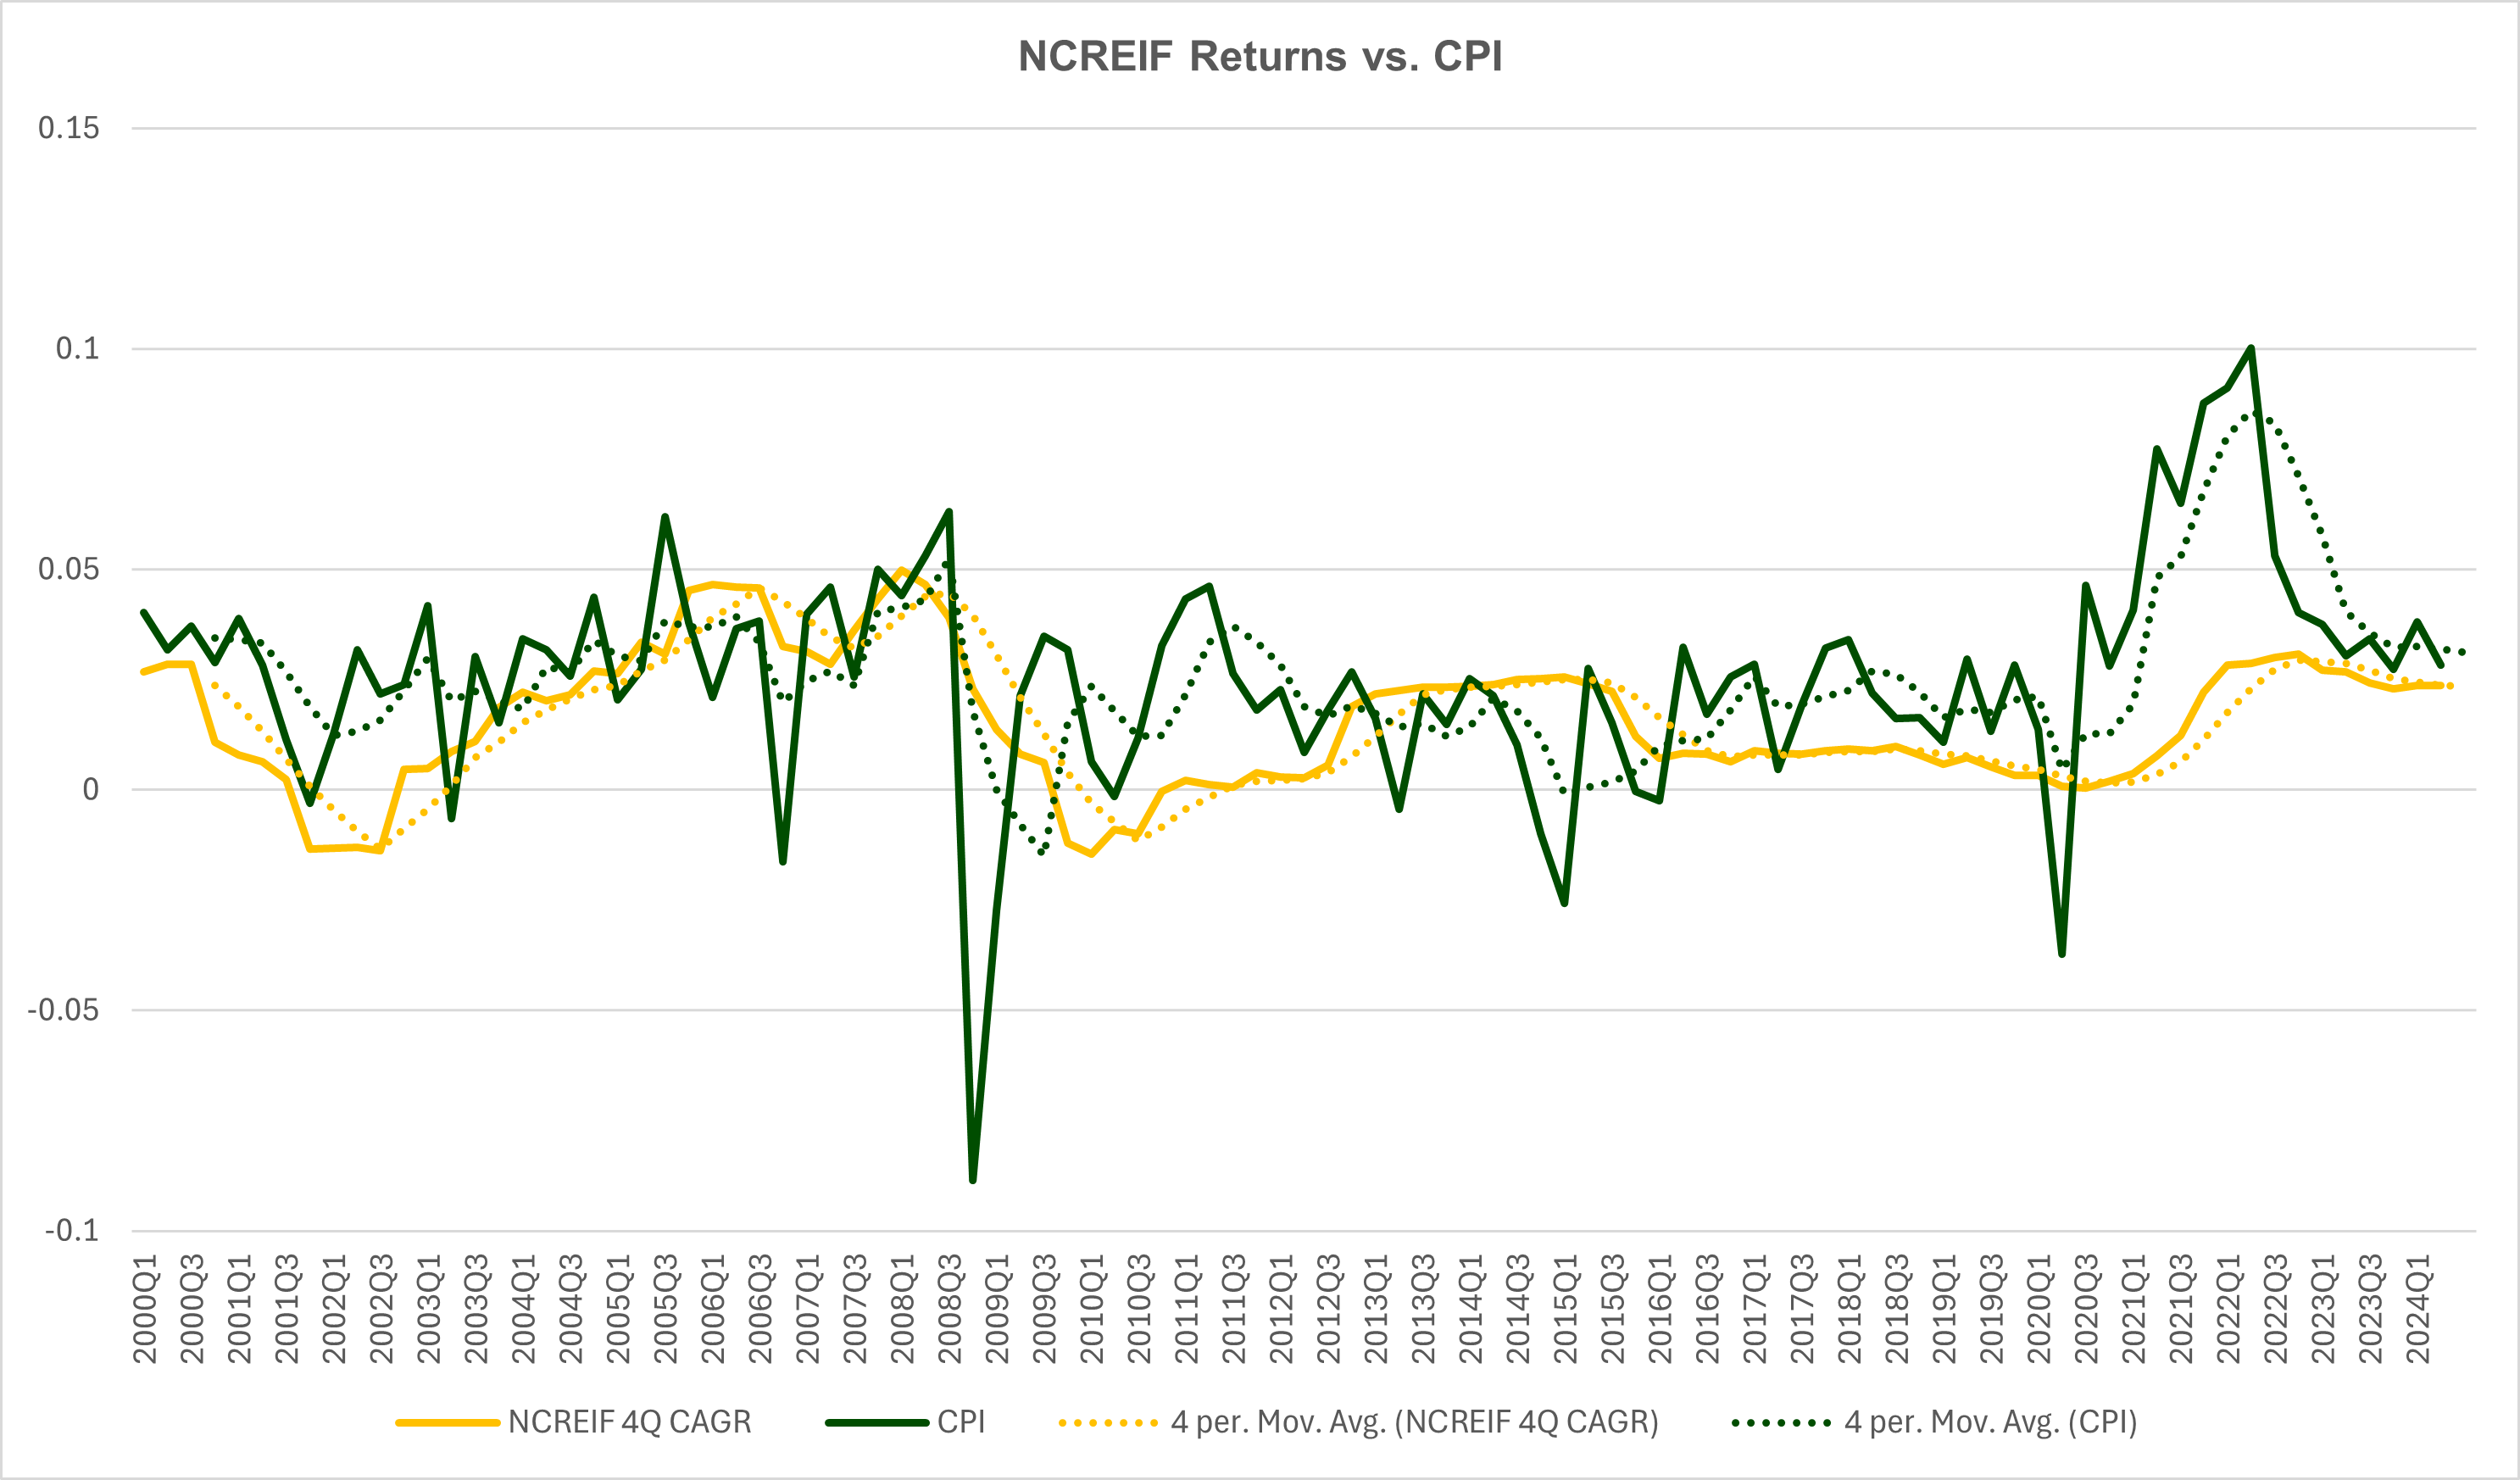
As previous analysis suggests, there are clear trends between inflation and timberland returns. We could be seeing a response in the market and that may add credence to the notion that timberland is an inflationary hedge. In addition, we may simply be observing the normal cycle of patient investors who acquired timberland as inflation increased, hoping to realize the higher values implied by the NCREIF per acre values. If so, the preliminary data indicates they invested successfully.
Leave a Reply