One scene in the Oscar-nominated movie The Revenant, features a group of trappers being pursued by a hostile party while trying to carry their injured colleague (Leonardo DiCaprio in an Oscar-winning role as a bear’s chew toy). The leader of the trappers offers increasing amounts of money to anyone in the group willing to stay behind with the injured man so the rest can flee, unencumbered, to the safety of their defended outpost. Eventually the bounty grows large enough to convince a small group to stay behind. This is a free market in action. Find the right price and someone will step up to do the job. When I speak with people about the issue of logging capacity, this is often the argument that I hear posed. Offer a high enough logging rate and businesses will expand (or start) to meet the needs of the market. In the recent Forisk Research Quarterly, we feature an article that examines the relationship between changes in logging employment, changes in logging rates, and demand for logging services over the past 30 years. Below is an excerpt from the article.
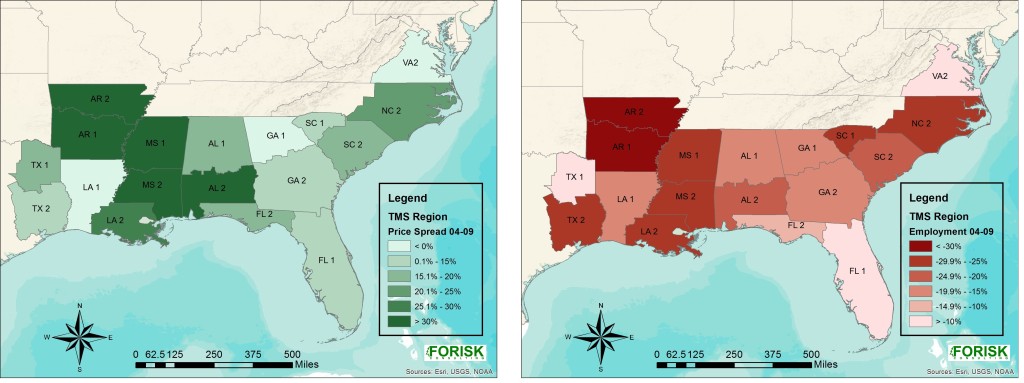
During the recession, the 18 sub-state markets across the South had a negative correlation between changes in the delivered-to-stumpage price spread (our logging rate proxy) and employment change. States with the largest declines in employment also had some of the greatest spread increases (Figure 1). This is counter-intuitive. South Central markets had some of the largest increases in the price spread, while also suffering employment losses of more than 20%. The Carolina markets saw some of the heaviest employment losses along the coast, along with greater increases in the spread.
Figure 1. Percent change in logging employment and stumpage-to-delivered price spread, 2004-2009.
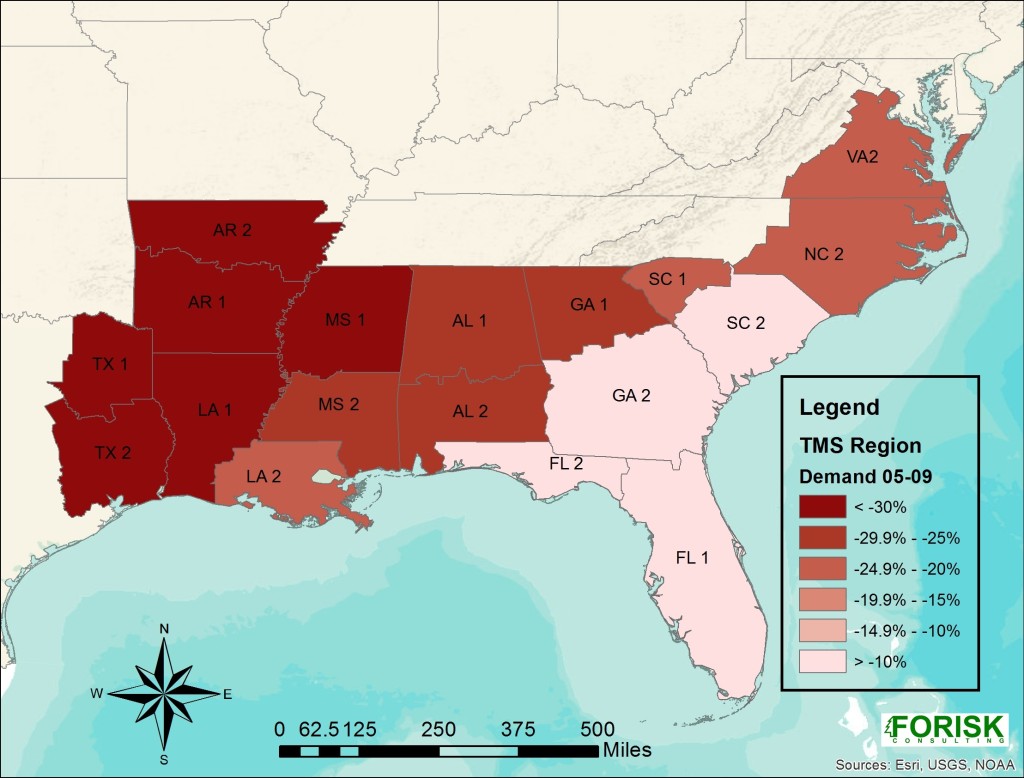
Better details on specific wood demand trends help explain why employment moved counter to rate trends (Figure 2). Employment tracked demand changes. The cause of the opposing rate movement is less clear. The market may have responded to reduced logging capacity by offering higher rates to the remaining contractors. Fewer markets accepting wood might have pushed contractors further out to deliver volume, driving up average haul costs as well. Diesel prices also increased significantly during this period. Whatever the cause, rates increased, but did not stanch reductions in employment.
Figure 2. Percent change in wood demand, 2004-2009.
To read the full article, see the Q1 2016 Forisk Research Quarterly. It is way more fun than being mauled by a bear.


Leave a Reply