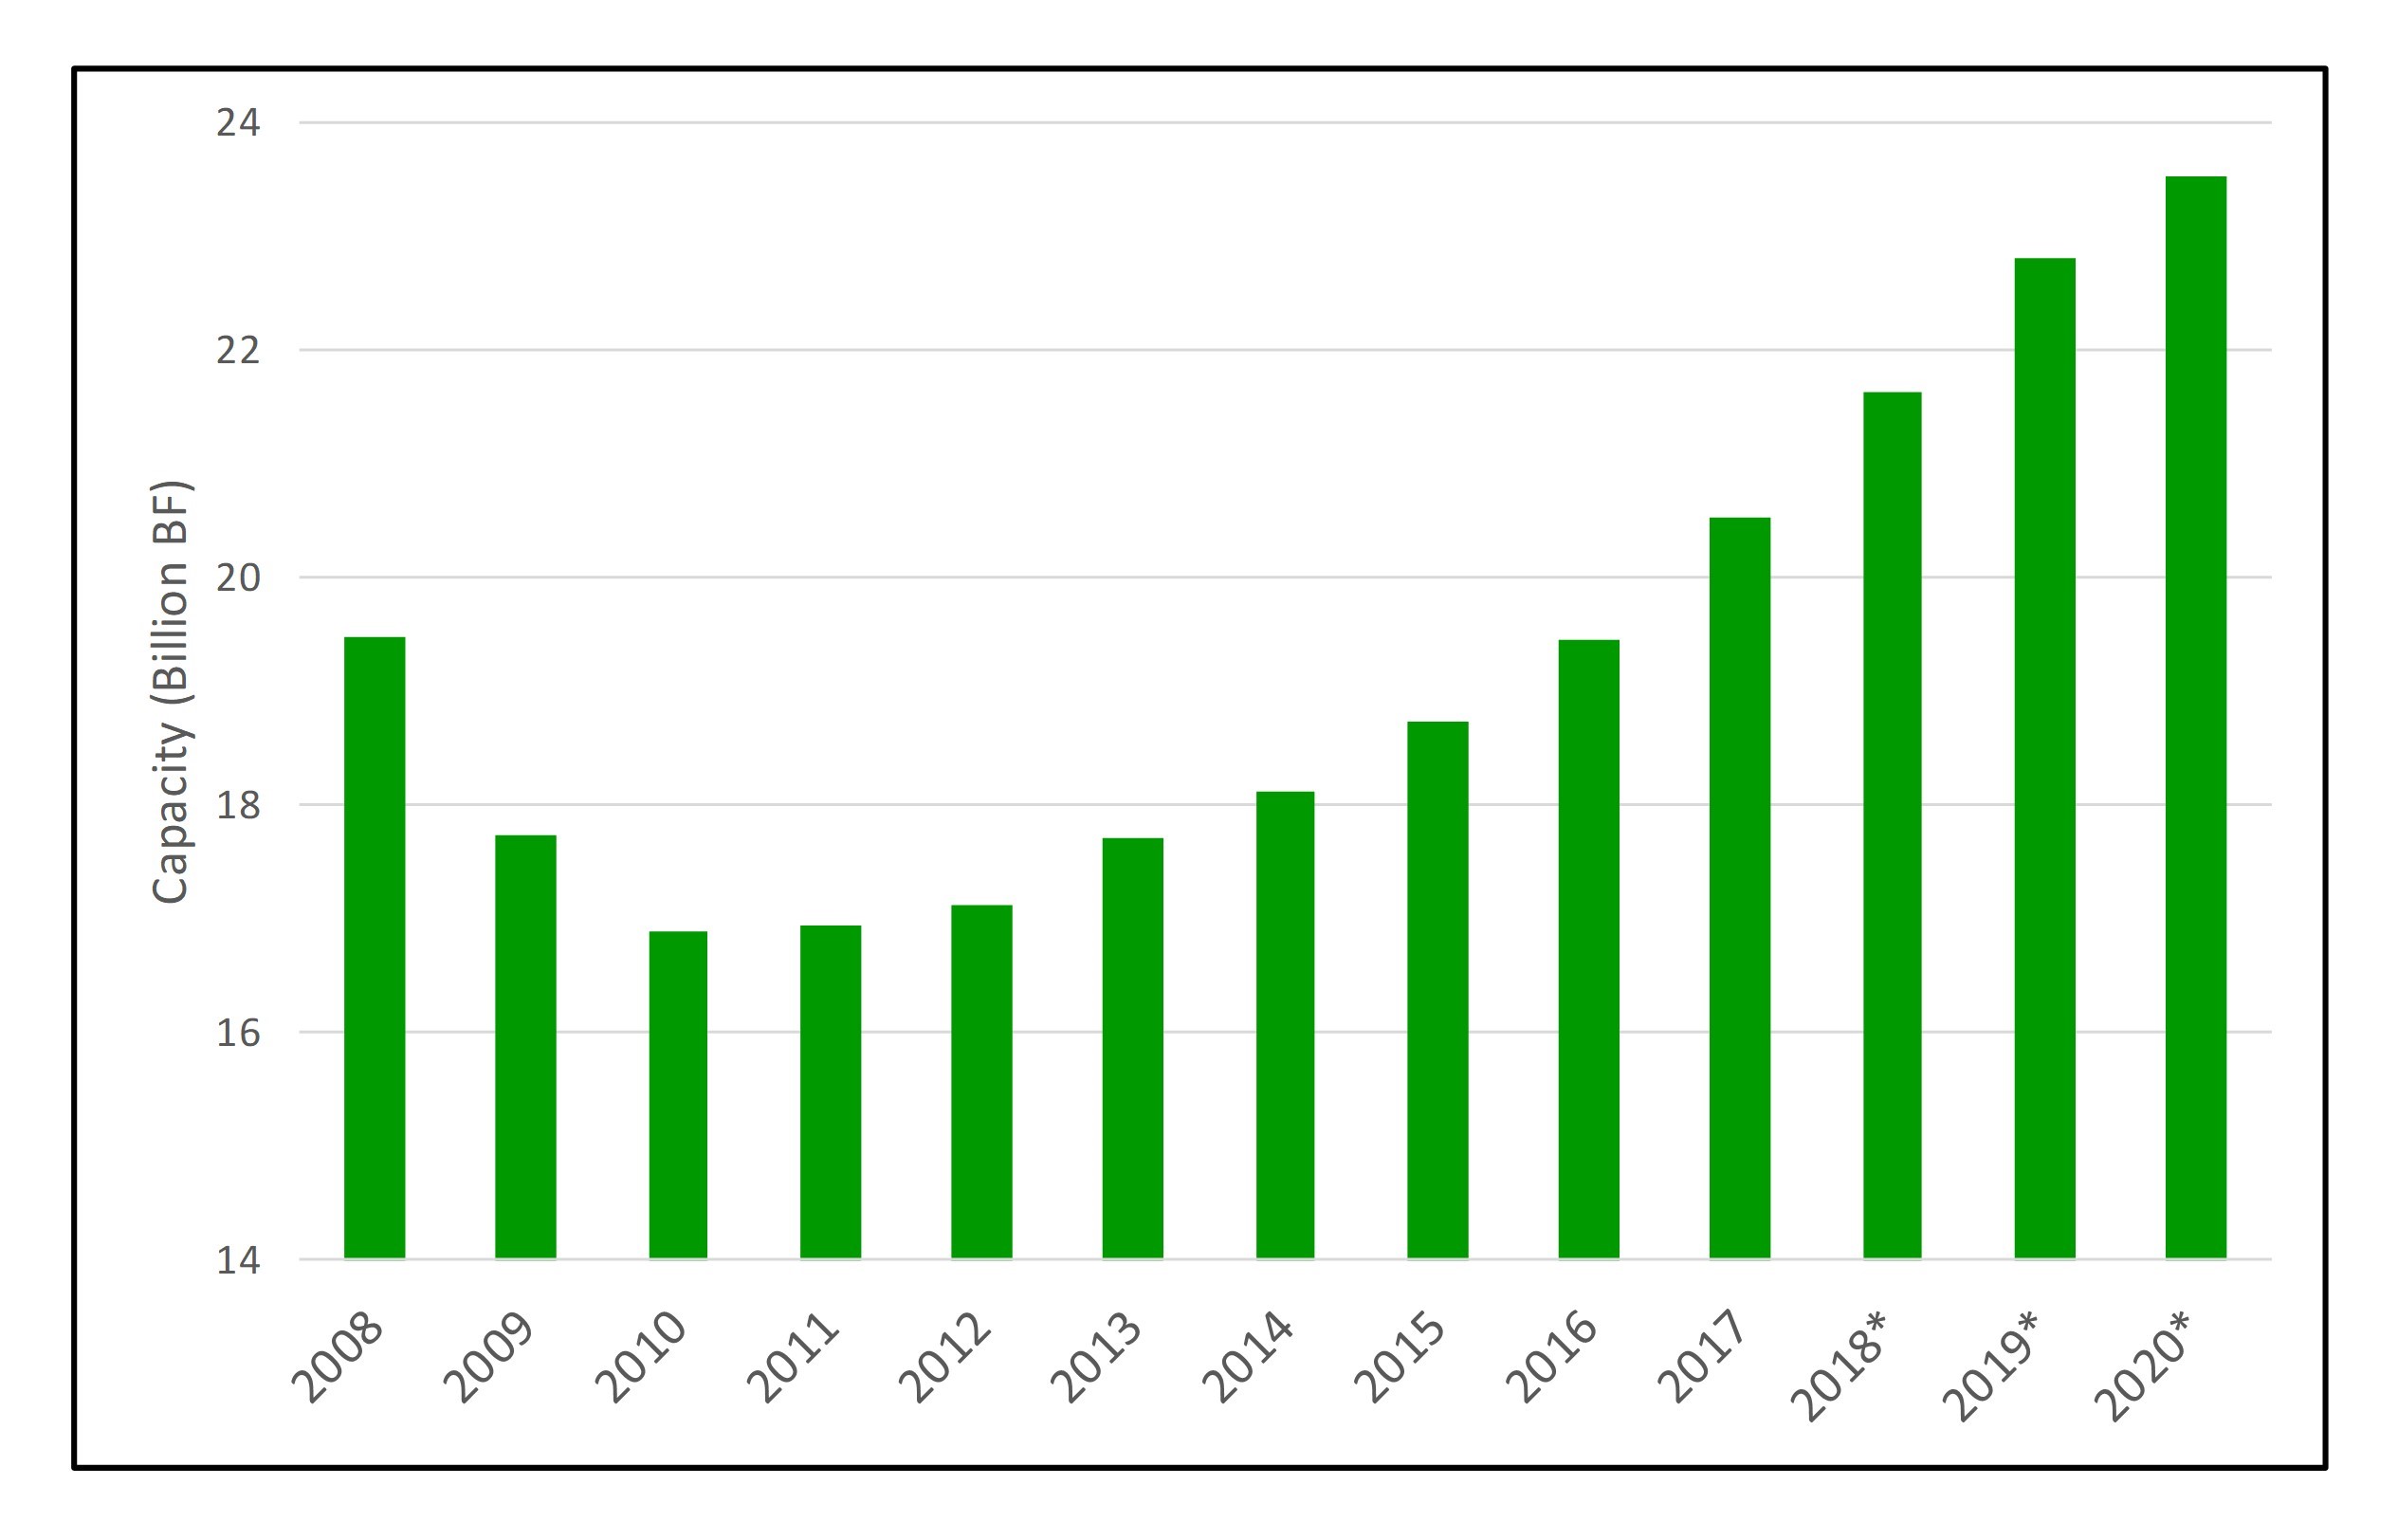
After yet another consolidating acquisition of southern sawmills, it seems like an opportune moment to review the changing profile of the softwood lumber industry in the U.S. South. At the end of 2008 – the early days of the housing crisis – southern softwood lumber capacity totaled near an all-time high of 19.5 billion board feet. A slew of mill closures in 2009 and 2010 trimmed capacity to below 17 billion board feet before beginning a long recovery. In 2017, this capacity finally exceeded its 2008 total and continues to climb at a steady clip.

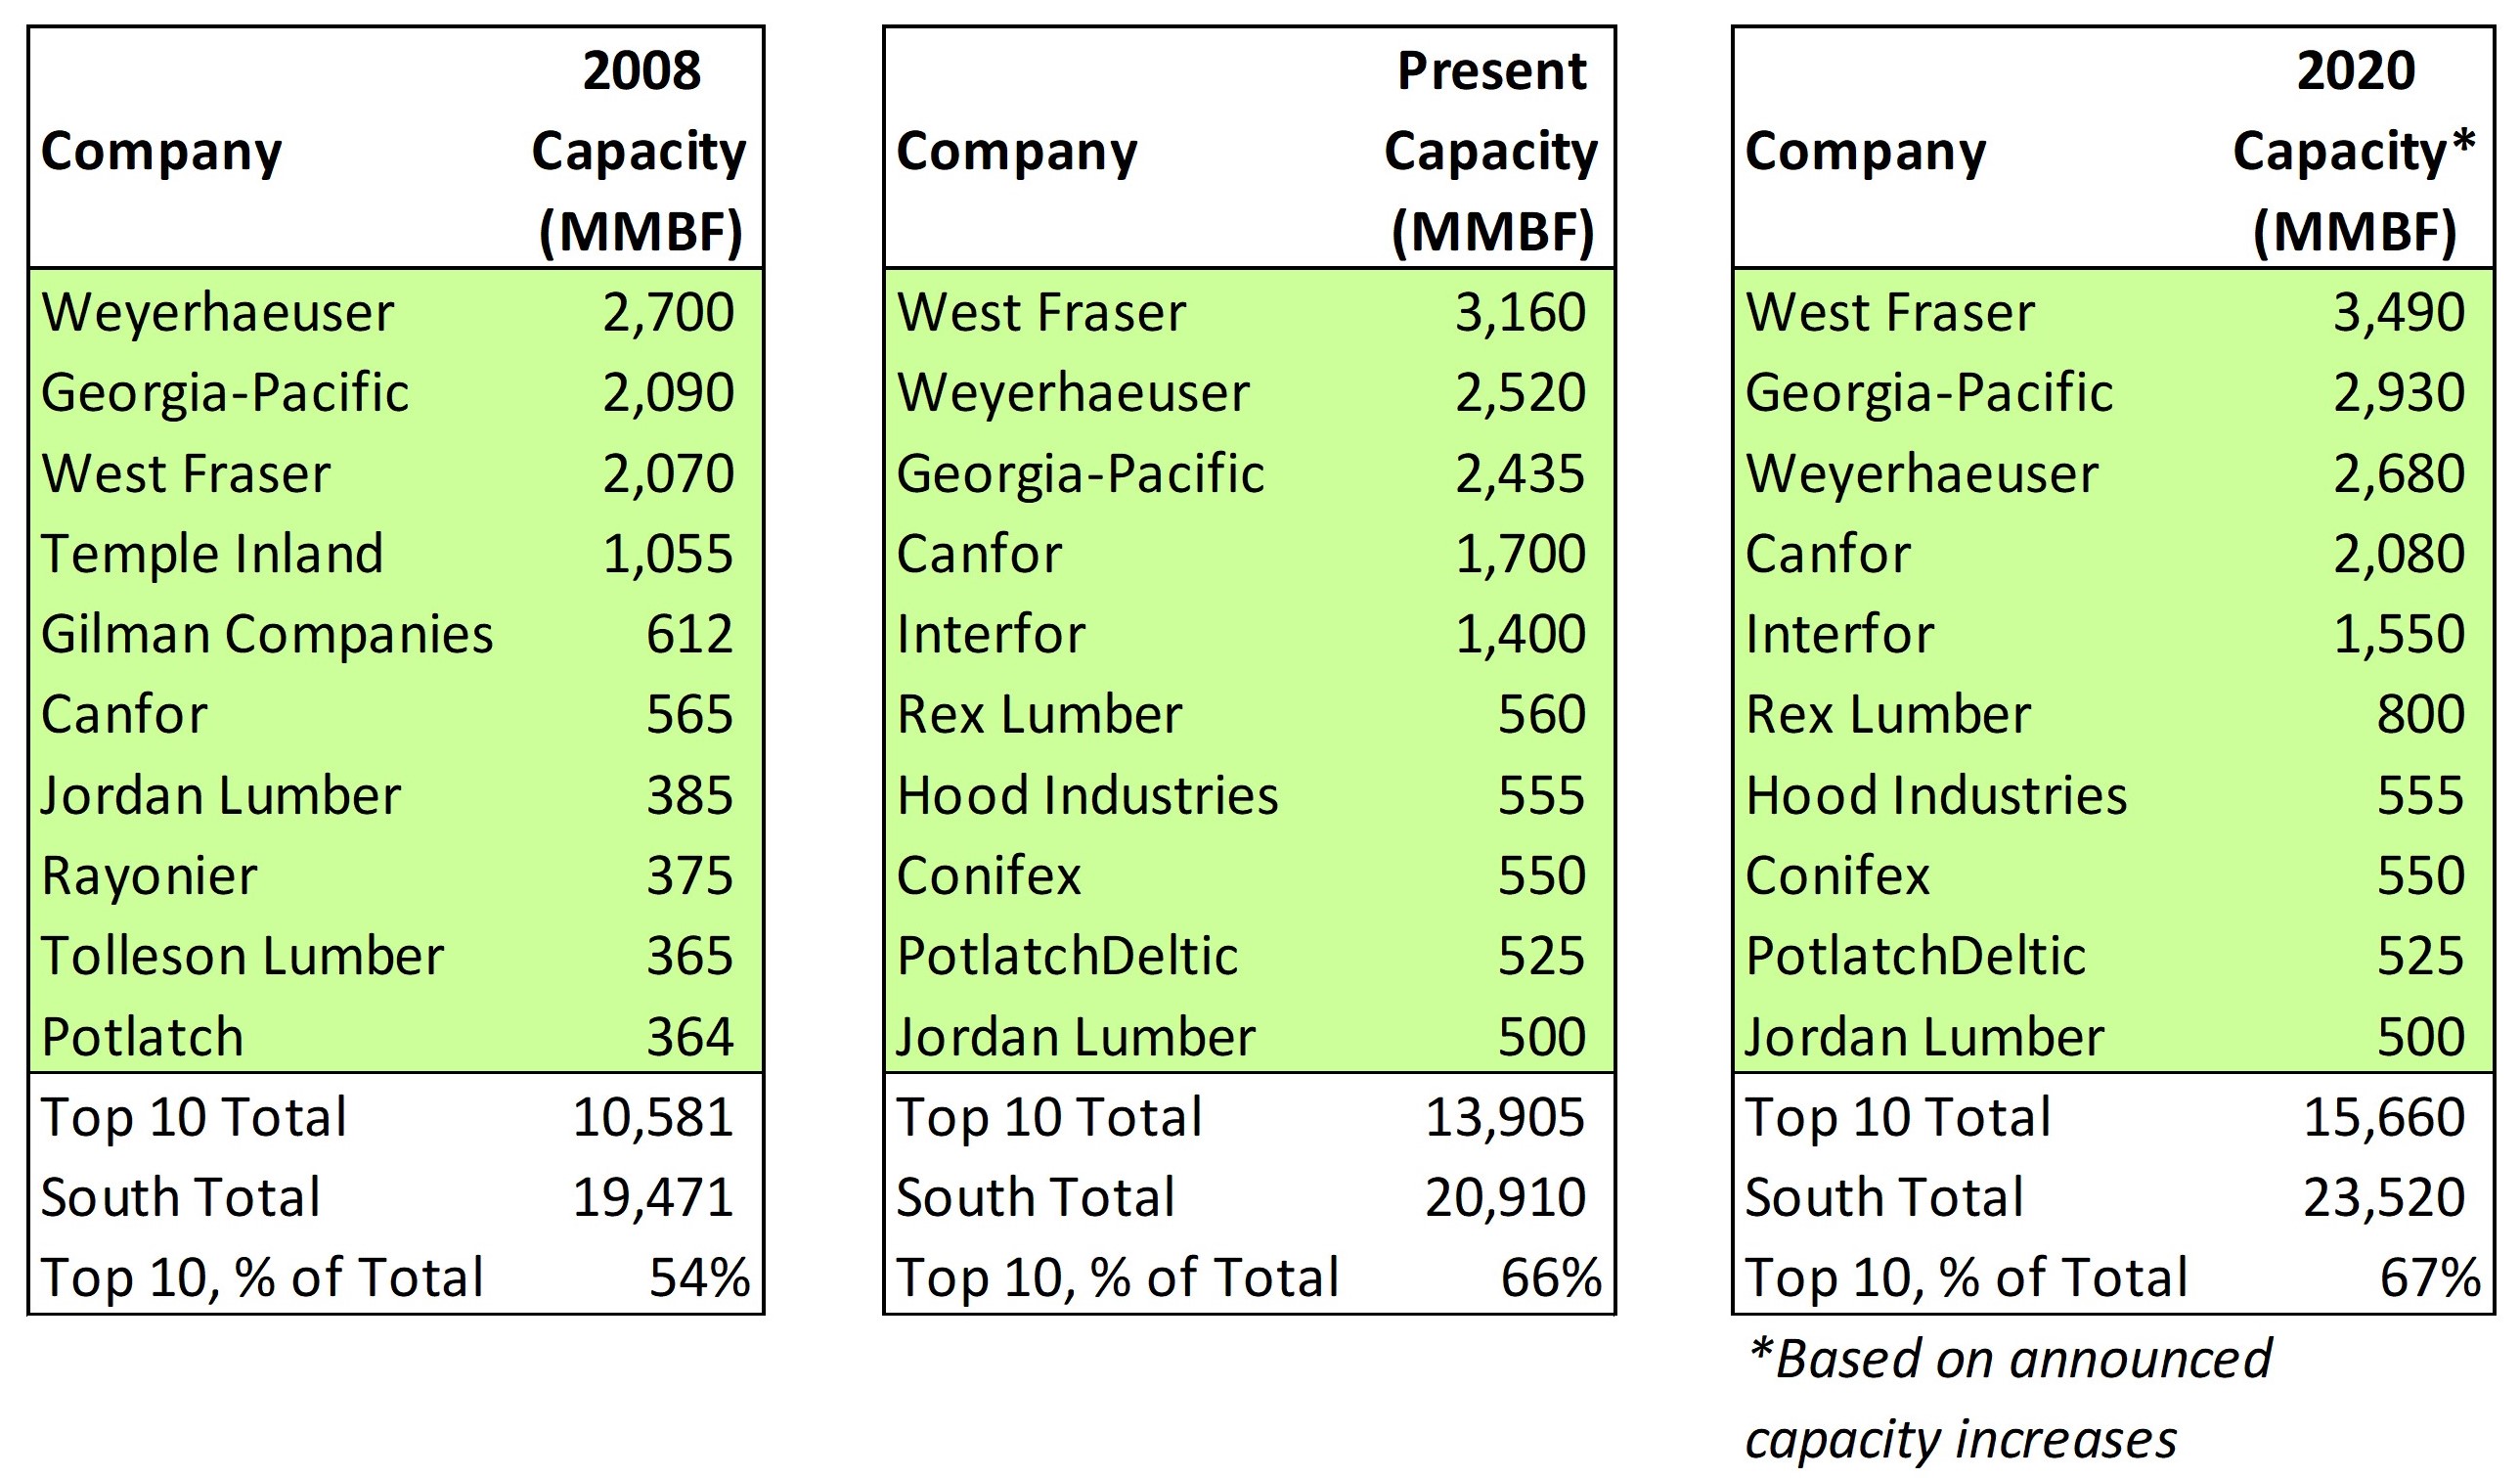
The southern sawmill story extends deeper than the aggregate capacity. The firms behind the capacity changed considerably over the past decade. In 2008, the South was led by the triumvirate of Weyerhaeuser, Georgia-Pacific, and West Fraser (as it is today). However, West Fraser and Canfor were relative newcomers to the region and the only Canadian firms to make inroads in the South. Southern lumber capacity owned by Canadian firms stood at 14% of the total, while the top ten firms combined to control 54%.
Today, the picture differs. West Fraser and Canfor aggressively expanded their footprints over the last ten years. West Fraser is now the region’s largest producer. Two new Canadian firms, Interfor and Conifex, also entered the top ten. Conifex is the smallest and most recent arrival, as its acquisition of Suwannee Lumber (Cross City, FL) and Caddo River Forest Products (Glenwood, AR) was completed just days ago. Canadian firms now account for a full third of the region’s lumber capacity.

The top ten firms comprise a greater portion of capacity (66%) than a decade ago. Four firms dropped off of the top 10 list (Temple-Inland, Gilman Companies, Rayonier, and Tolleson). Looking forward, we expect the ranking of the top ten to change little by the end of 2020, but most of the firms represented have announced plans to further increase capacity by expanding existing mills and/or building greenfield mills.
The data for this post was pulled from Forisk’s comprehensive analysis of North American wood-using current and historic capacity by firm and sector across North America, along with projected capacities by sector and region for the next two years. For more information, click, here.

Justin, how will Klausner I and II fit into the equation?
Jim
Good question, Jim. We’re keeping tabs on the situation with Klausner, and our current understanding is that the capacity at Klausner I is well below targeted levels. When (if) Klausner II opens later this year, we expect a similar situation, which would prevent them from cracking the top ten even with both facilities open.
Justin,
What about Westervelt? They announced a new facility earlier this year, although we don’t know where. I know their Moundville, AL facility is pretty large but I do not know what their total production is.
Does the South Total Production capacity include the new Hunt Forest Pro and Tolko Industries Mill (LaSalle Lumber Company LLC), Angelina Forest Products (Lufkin, TX), Two Rivers Lumber LLC (Demopolis, AL) and Biewer Lumber LLC (Newton, MS)?
Also, what do you think the chances are of the Klausner Mills ever getting up and running?
Steven, that’s another good question. We’re aware of the Westervelt announcement, but it won’t go into our capacity projections until they announce a location. I won’t be surprised to see Westervelt back in the top ten in two years, but as of today we only include their Moundville location. The other greenfield announcements that you mentioned – and several that you didn’t – are all accounted for in these projections.
Justin – What was the low point for lumber production after the GFC? Our estimate was well below 17 billion board feet? Also, how does Forisk account for mill percent production as the markets improve. With more mills moving to increase shift time per week and reduce down time associated with maintenance, how does this impact the productivity of the installed base of mills. Thanks.
Mike, you are absolutely correct. According to WWPA, softwood lumber production in the South bottomed out at 11.8 BBF in 2009. The numbers represented in this post reflect what we think of as “operable capacity” – i.e., how much lumber could the existing sawmill infrastructure that is currently operating (or could be operating at the flip of a switch) produce in a year? We reconcile production with capacity by calculating the utilization rate, a simple ratio of the two.
In 2009, The utilization rate dropped to 67%, but it has steadily recovered and now stands above 90% – a clear indication that mills are making better use of the infrastructure available to them, as you mentioned, by increasing the number of shifts, switching to longer shifts or workweeks, and minimizing downtime. However, one can only push the utilization rate so far before Murphy’s law pays a visit. We may see individual mills, but not entire sectors, maintaining utilization rates above 95% of rated capacity for extended periods of time. Since we are reaching the limits of what we can expect existing infrastructure to produce, it’s natural to expect additional gains in production will not come from increased utilization, but from improvements to or expansions of infrastructure. The present rate of sawmill investments in the South bears out this expectation.