This is the second in a series related to Forisk’s Q3 2019 forest industry analysis and forecasts for the United States and Canada.
When reviewing the returns of public timber vehicles, we remind ourselves of the importance of starting price. The primary driver of returns in this math, as with private timberland investments, is the price at acquisition. This holds regardless the outlook for and volatility of the economy.
Fortunately, timber equities, whether REITs or MLPs, also deliver consistent cash distributions. With this in mind, Forisk intern Tyler Reeves sifted through the cash yields of public timber firms over the past three years to help us make a few comparisons and observations.
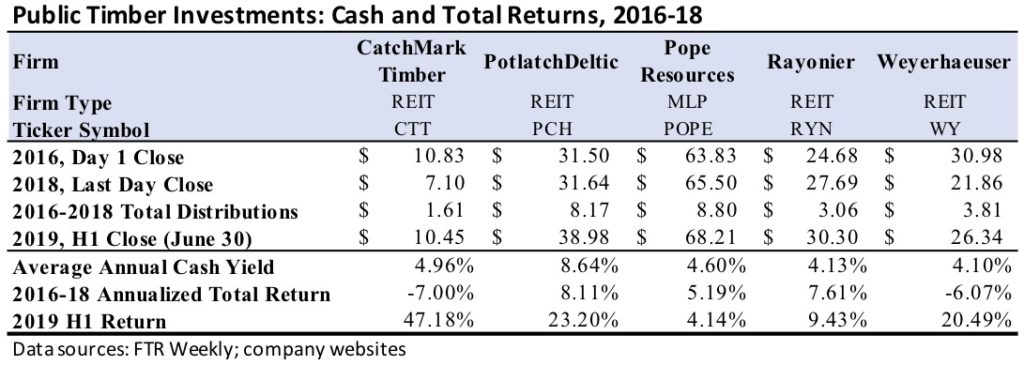
The table above summarizes cash distribution and share price data since 2016 for the four public timber REITs and the one public timber MLP. On average, for investors buying shares on the first trading day of 2016, these firms generated cash yields exceeding 5% per annum (partly thanks to a special distribution by PotlatchDeltic in 2018; thanks!) All firms exceeded 4%. The three-year total returns, however, remind us of the real volatility at play, as two firms produced negative total returns. Regardless, all firms had strong 2019s through the first two quarters.
Any story about prices or returns getting back to normal, returning to trend, or reverting to the mean presumes that an average return on investment exists. It assumes that deviations from the mean are temporary. Our experience is that average, acceptable and expected are in the eye of the beholder and subject to context. Are you a buyer or a seller? Is this asset tactical or strategic? Are you in it for the cash or the appreciation?
Leave a Reply