This is the third in a series related to Forisk’s Q3 2019 forest industry analysis and forecasts for the United States and Canada.
Everyone can relate to the sensation of barely recognizing an old friend you’ve run into at a reunion or in a chance encounter. Losing weight, gaining weight, new hair, or no hair, the passage of time affects us all. Barring some unfortunate accident (or your acquaintance being a Gallifreyan), what we’re seeing as a radical change is merely the accumulation of years of small changes. Seeing someone at the start and end of a long period of time emphasizes all the little changes. But each of those minor changes has a story behind it as well. It helps sometimes to understand the story.
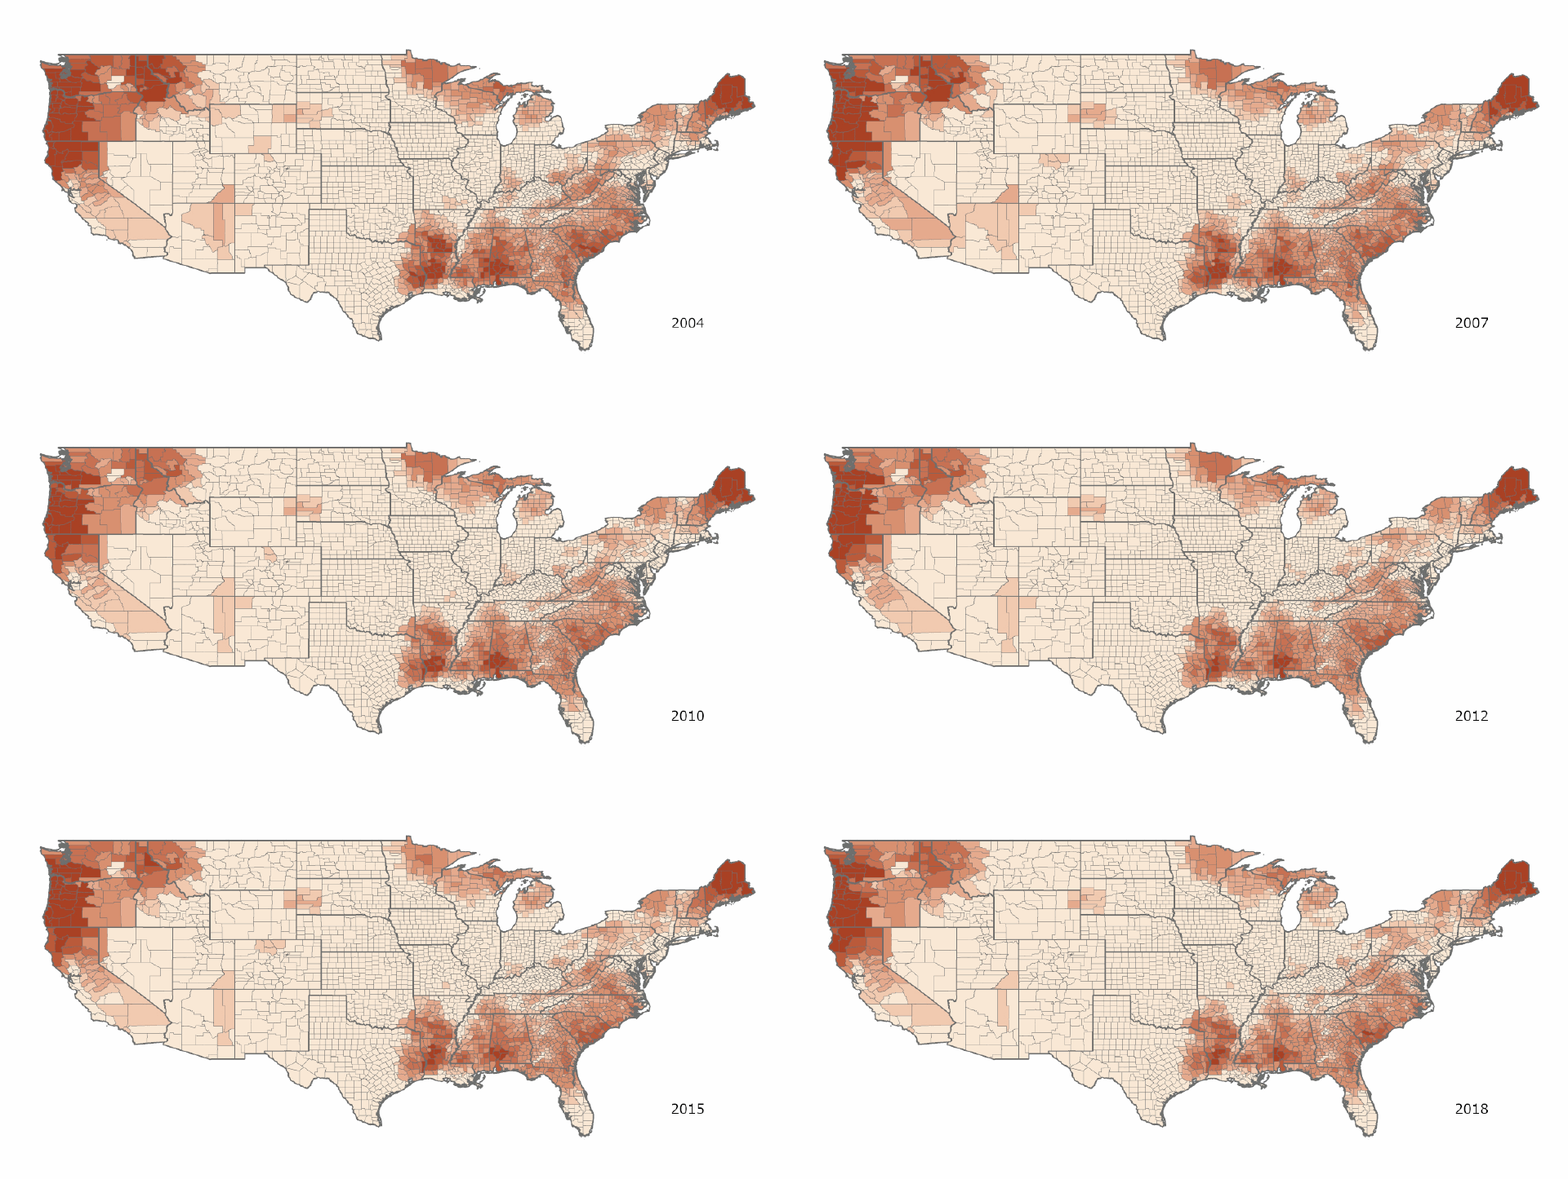
Forisk examines employment trends quarterly to find areas where logging capacity may be out of sync with the forest industry. Since the Recession, employment has been comparatively stagnant compared to the years leading up to the Recession, while the industry has been growing. Yet when you compare employment pre-Recession to today, the scale of the change is substantial (Figure).
 Figure: Logging Workforce by County, 2004-2018*
Between 2004 and 2018, total employment in logging dropped by 25%. Almost all of that decline happened between 2004 and 2010. While there was a slight rebound in national employment since 2010, average logging employment in 2017 and 2018 was as low as ever recorded (logging employment dropped by a further 25% between 1990 and 2004). We’ve noted before the tremendous impact of mechanization on logging productivity, which has enabled the U.S. to maintain a similar harvest level despite drastic declines in employment. The changes in the scale and distribution of the logging industry highlight this. For much of the country, the level of employment simply declines over time. Shifts, such as they occur, are largely in smaller markets such as southern Indiana. Fairly drastic reductions occur in Appalachia and the Inland West, where the Recession’s impact is rapid and severe.
When the employment map reverts from 2018 to 2004, many counties across the country become a darker shade of red. That reddening represents thousands of people who were logging just 15 years ago. Every year, the map changes as businesses close and new ones open. Today the logging industry has far fewer loggers each producing more wood than 15 years ago. It is certainly recognizable as the same industry, but far leaner.
*Forisk allocates county-level employment to adjacent counties to represent contractor availability across larger areas and identify areas of higher employment density.

Leave a Reply