This post introduces research covered in the Q1 2020 Forisk Research Quarterly (FRQ).
I’m not the world’s biggest baseball fan (I’m not even the biggest baseball fan at Forisk), but the quantitative nature of the game does appeal to me. For example, I know Gregory Soto isn’t the best hitter in baseball, but he was the only player to bat 1.000 last year with more than one official at bat (he had 2). Why discuss the hitting stats of American League pitchers? Because perspective matters. Knowing Tim Anderson “only” hit .335 but came to the plate over 500 times in 2019 gives the proper perspective for comparing the hitting prowess of both players.
Bringing this back to forestry, we’ve commented frequently on the declines in logging employment regionally and nationally in the U.S. Employment declined dramatically during the Recession and increased only slightly during the recovery. Indeed, employment is lower now in the logging industry than at any point since the government started tracking the industry. Another trend we highlight is productivity of the logging sector. The industry has mechanized and output per employee has grown consistently for decades. Logging is now characterized by fewer, but more productive, employees. So how do we view the status of the industry’s actual capacity to harvest wood?
We offer some perspective. Forisk tracks reported changes in logging employment at the county level to identify where capacity may be growing or shrinking. We also track all wood using facilities in the country to provide a perspective on wood use. By combining the two data sets, we can identify areas where employment growth notably exceeds or lags the pace of wood demand growth.
Logging Capacity Relative to Softwood Roundwood Demand Changes
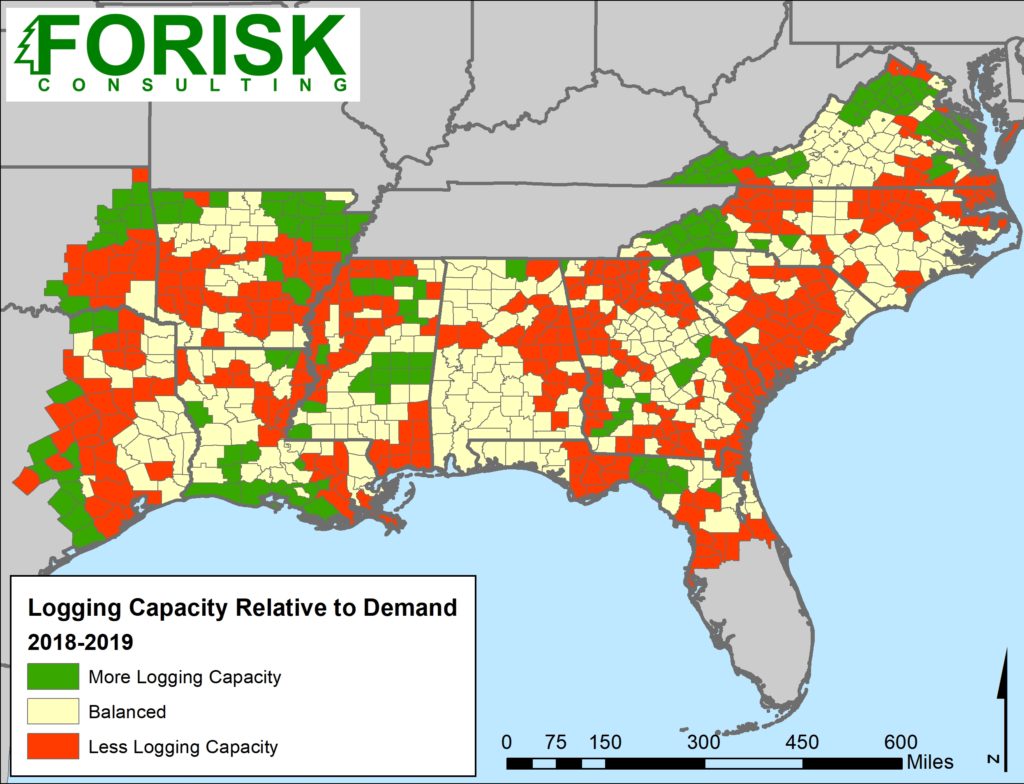
The figure above provides a view of softwood demand changes relative to logging capacity. Is this a perfect picture…not exactly. While it excludes hardwood demand, softwood dominates the volumes harvested by the logging sector in most of the highlighted region. What does the map show? In a number of areas, demand growth over the past year exceeded changes in logging employment by 10% or more. These regions often have newly opened facilities that are likely to attract new logging capacity, such as in northeast Alabama where recent openings and expansions should draw in more loggers. Other areas remain a concern where demand has been less dynamic and employment is declining, such as central South Carolina or southern Arkansas. In those areas, we want to watch carefully and ensure short-term capacity tightness does not extend to long-term shortages. As for those outlying regions where employment growth exceeds demand? Those are the figurative Gregory Soto’s of the map, where hardwood (not softwood) dominates the harvest volumes, or where there is little harvesting at all. It helps to maintain some perspective.
In my view, the lack of logging capacity limits demand making this somewhat counterintuitive. There are counties on your map showing excess logging capacity where I find it more difficult to sell wood, partially because of the lack of logging capacity.