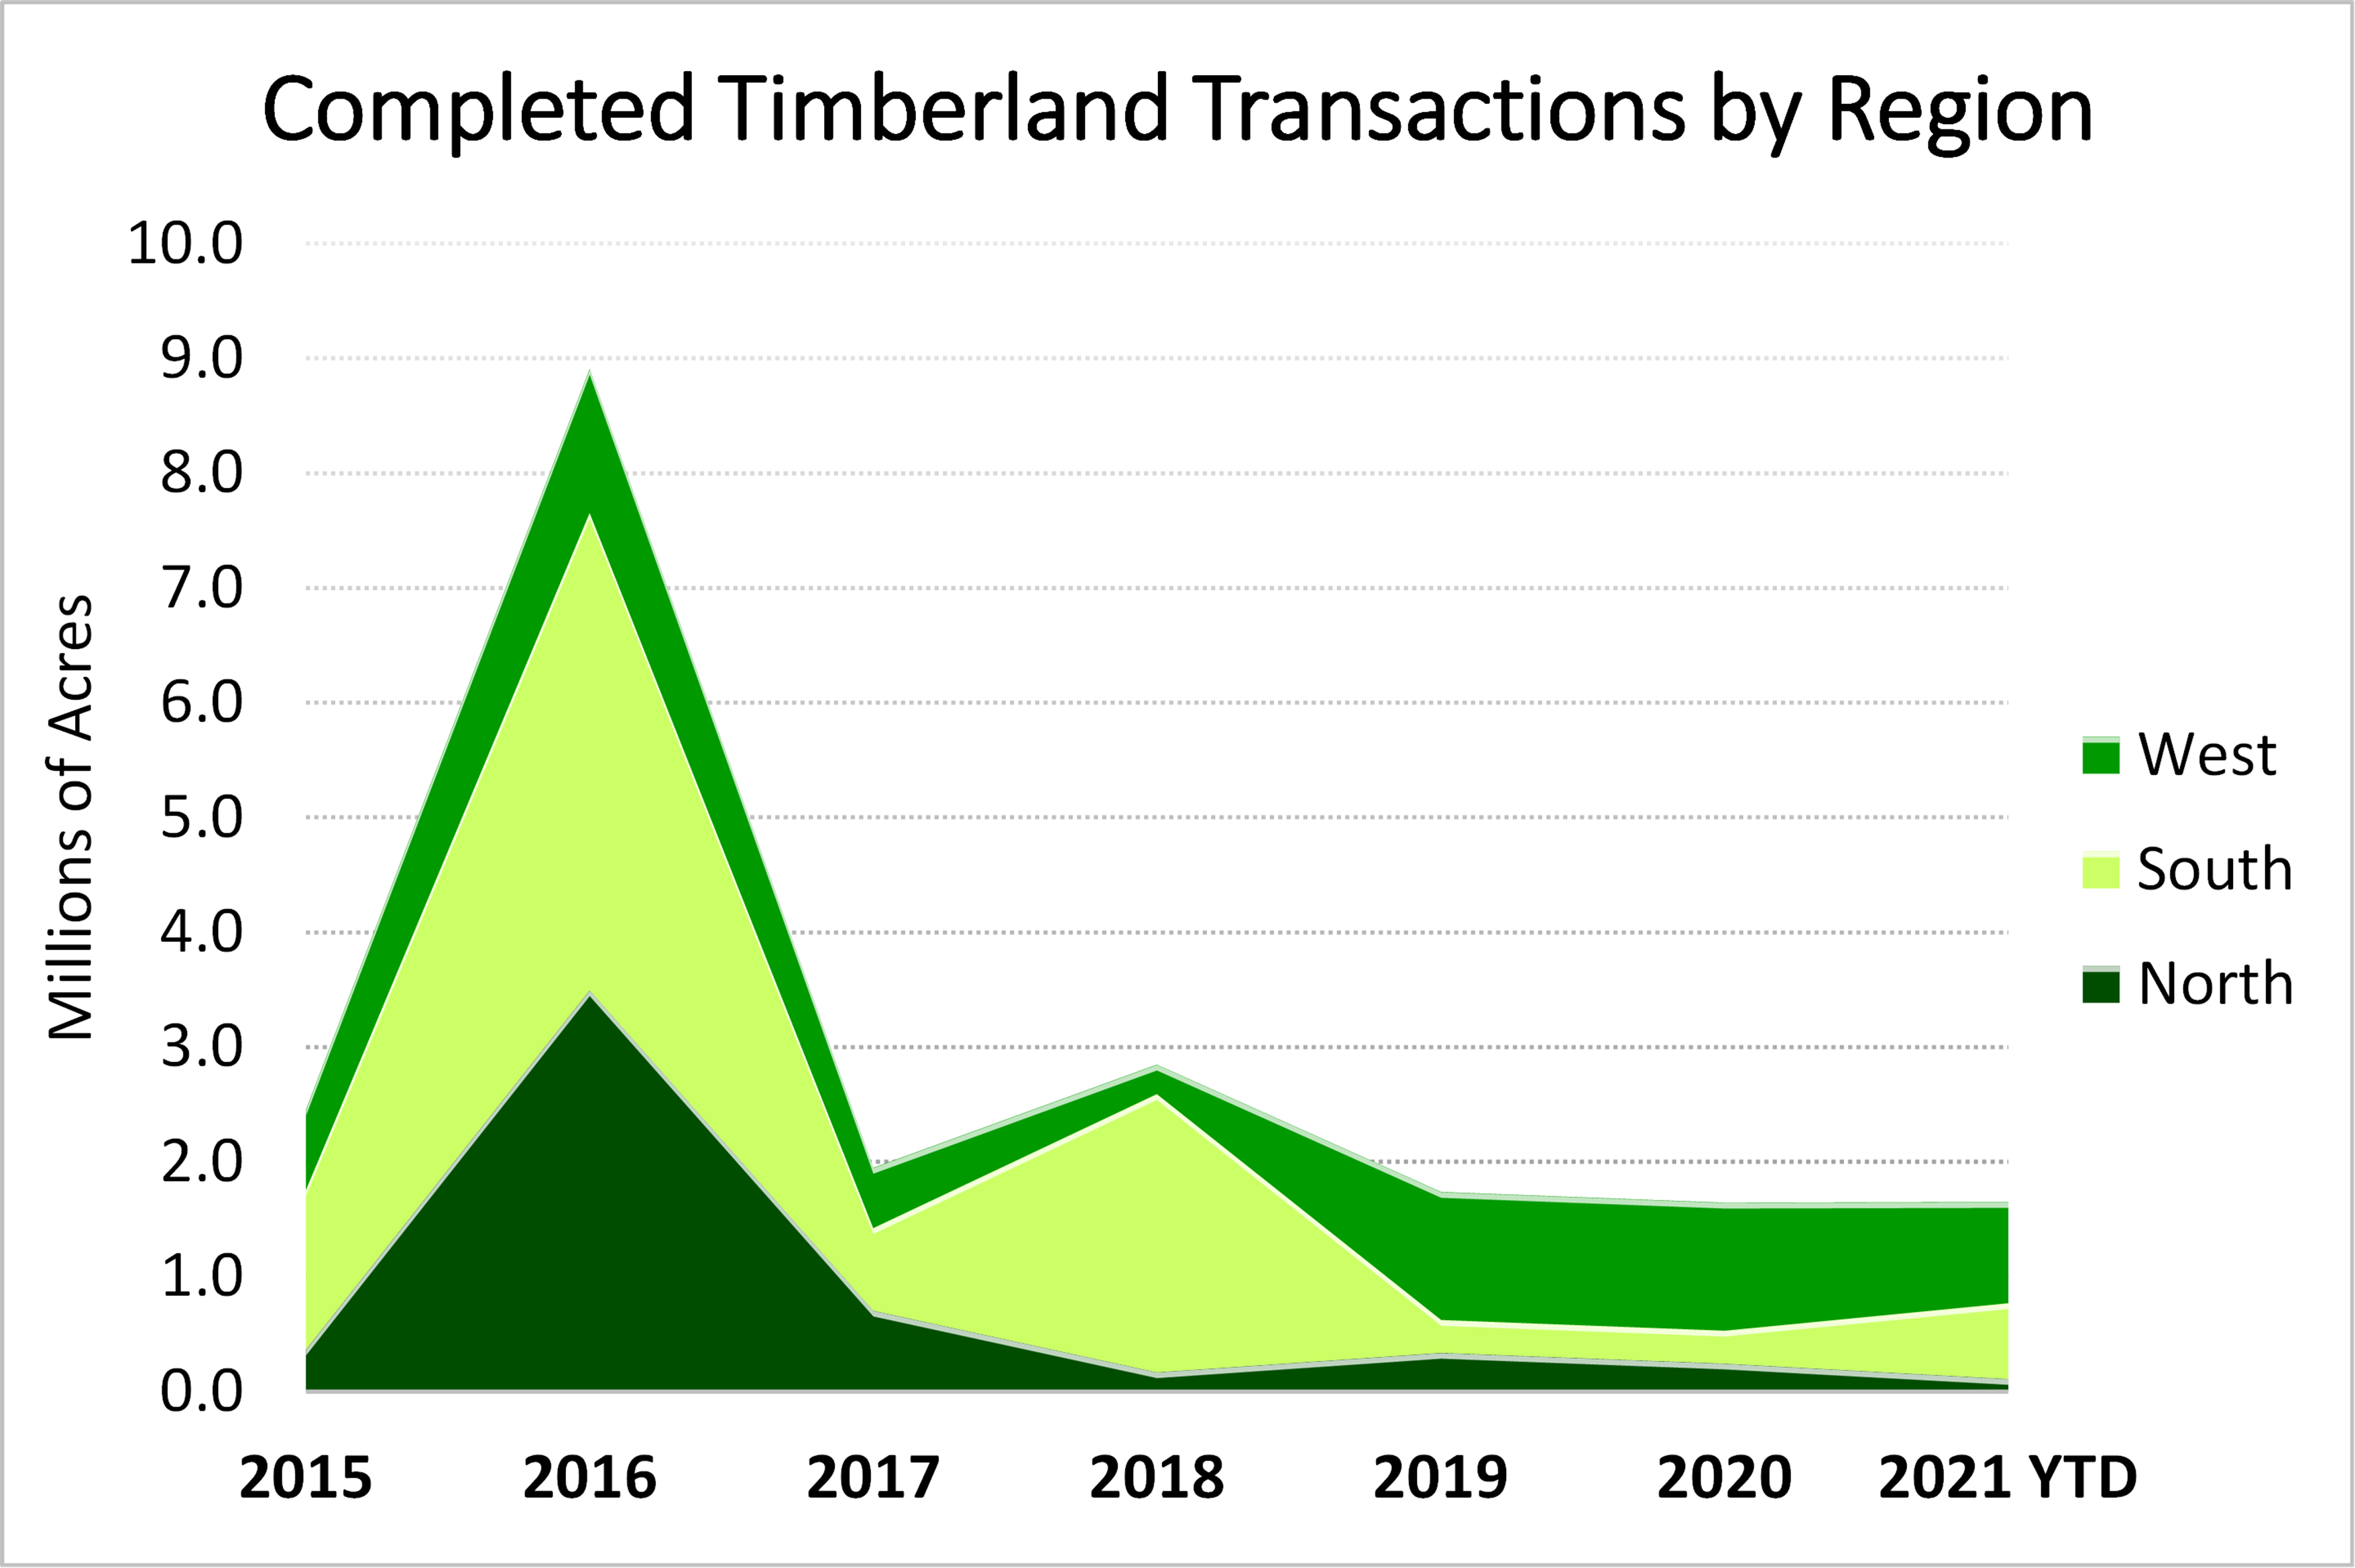
Just over 1.7 million acres of U.S. timberland changed hands in 2020. This represented a 32% decrease in transaction volume from a 10-year median value of 2.5 million acres per year. However, in 2021 transaction volume bounced back, and by September the transaction volume nearly reached year-end 2020 levels (see figure below). In the third quarter alone, nearly 800,000 acres of sales closed. That said, a gross acreage estimate does not provide sufficient context for the recovery magnitude. To fully appreciate how much we rebounded, we need to pay heed to the financial aspect of the transaction market as well. In the words of Rod Tidwell, “Show me the money!”
As part of Forisk’s timberland tracking, we also estimate the total timberland investment for the U.S. year-to-date. To generate this value, we include known price points and use NCREIF regional averages to help inform our estimates where prices are not disclosed[1]. Comparing the year-to-date value to the same metric from the end of Q3 2020, total timberland investment rose significantly year-over-year. U.S. timberland investment for 2021 is estimated at approximately $2.2 billion, up 83% from last year ($1.2 billion). And we expect this estimate to climb further, with additional announcements expected to close by the end of the year[2],[3].
Lastly, we utilize our price information to generate regional timberland cost/acre averages[4]. The Northern U.S. had the lowest average cost/acre ($800/acre), followed by the U.S. South and U.S. West at $1,800/acre and $3,300 acre, respectively. Our timberland tracking does not distinguish between the Northeast and Lake States regions, combining data from both to generate a North region average. Western timberland values represent the highest average value and are heavily influenced by high price per acre values in core market areas.
For details on recent timberland transactions and mill investments, subscribe to the Forisk Market Bulletin
[1] Forisk used NCREIF averages where appropriate. In circumstances where exact price disclosures were not provided but NCREIF regional averages were likely to vary considerably from actual sale price, regional estimates were modified to reflect comparable sales in the area.
[2] https://www.goldendalesentinel.com/news/new-directions-for-sds-lumber/article_6d01b808-adb8-11eb-90b5-df52f5eb6724.html
[3] https://www.capitalpress.com/sponsored/sierra-pacific-industries-and-seneca-plan-to-combine-family-owned-forest-products-businesses/article_f8effac0-fa3c-11eb-a3f3-c374e460ff1c.html
[4] These averages do not include NCREIF values and are based entirely on transactions with known sale prices.
Leave a Reply