At the start of each year, we look back on our performance over the past twelve months and look forward to our expectations for the next twelve. George Box, a famous statistician, has a quote that provides me some solace this time of year, “All models are wrong, but some are useful.” This thought may be cold comfort to presidential election prognosticators and those who misinterpreted their probabilistic predictions. For those of us in the business of prediction, though, it is important to remember that our models are simplifications of the complex and will rarely be perfectly accurate.
Every quarter Forisk forecasts logging rates for the US South, North, and West. Our forecasts are based purely on cost expectations and rely heavily on diesel cost forecasts published by the Energy Information Administration. We have published our logging cost forecasts in the Forisk Research Quarterly for the last two years. This gives us some basis for reflection and assessment of our performance. Our southern logging cost forecasts are based off of Timber Mart-South’s Piedmont clearcut logging rate. We can compare our predictions for 2015 and 2016 against actual rates, to see how we did (Figure 1).
Figure 1. Reported clearcut logging rates in the Piedmont compared to Forisk predicted rates in 2015 and 2016. Error bars are the high average and low average rates from Timber Mart-South.
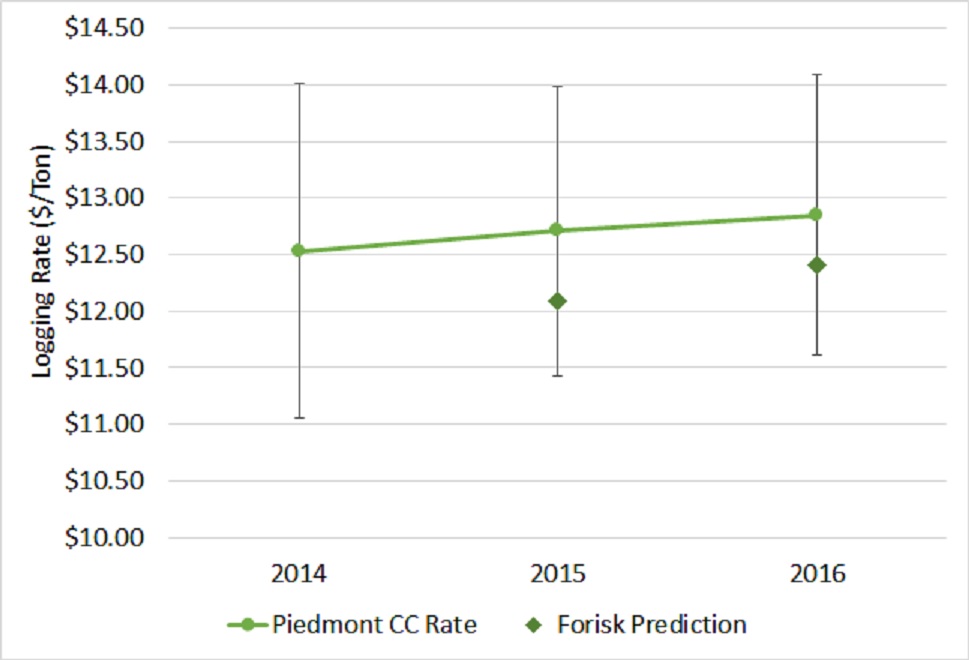
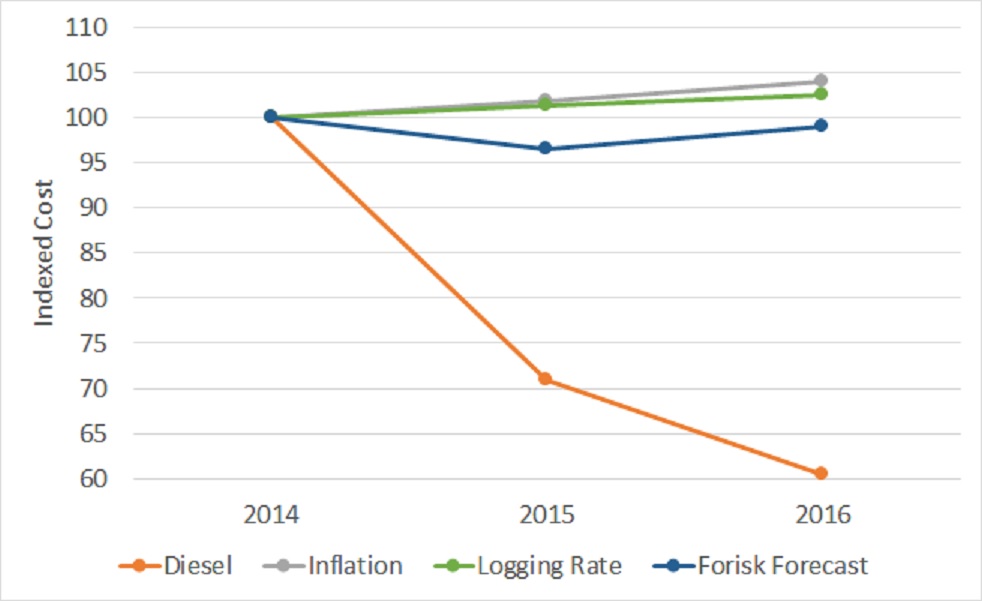
Our initial forecast in Q1 2015 for year-end 2015 logging rates missed the actual by 4.9%. Last year’s prediction for 2016 rates missed by 3.4%. Both were well within the range of low and high average rates reported by TMS. Where did we go awry? Our models use an expectation of the impact of diesel prices on logging costs as a basis for our predictions. Over the last two years, diesel prices have dropped precipitously (Figure 2). Almost every other cost has increased, if only slightly. Actual rates have also inched slightly higher, more or less in line with inflation, while our expectation of a downward pull on rates from diesel prices has not occurred.
Figure 2. Indexed values for retail diesel prices, consumer inflation and reported and forecast logging rates.
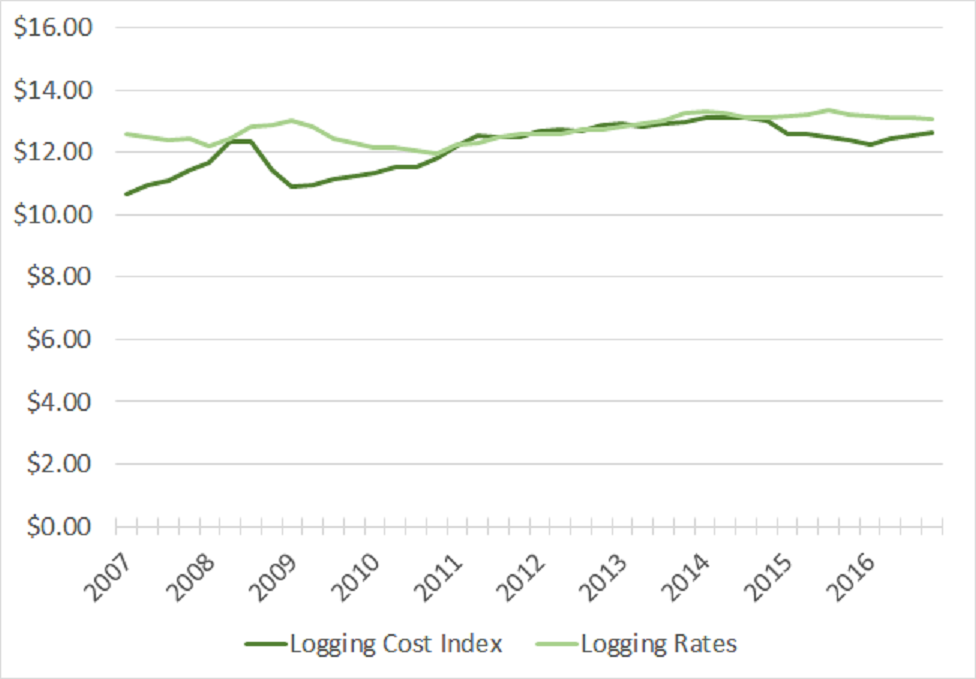
There are a number of possible explanations for all of this. Our forecast is cost-based and our measuring stick is a market rate. It is quite possible that the profit margin has increased slightly in the logging sector after half a decade of being razor thin. A comparison of the UGA Logging Cost Index to reported logging rates shows that some of the margin that appeared to be present heading into the recession has returned in the last couple of years (Figure 3). What does this mean for our predictions moving forward? As with all forecasts, they will be wrong, but we want to ensure that we maximize our prediction accuracy as much as possible. We recalibrate our models to market conditions continually, and the current profit margin should be included in our future views. Assuming the margin stays in line with its current level, we feel we have a fairly accurate view of logging costs in the future. That qualifies as “useful”, right?
Figure 3. UGA Logging Cost Index and reported Timber Mart-South logging rates, 2007-2016.
To learn more about the Forisk Research Quarterly (FRQ), click here or call Forisk at 770.725.8447.
Leave a Reply