The pursuit of the ‘preferred answer’ starts early in life. Any two-year old knows to ask Dad after Mom says, “No.” In forestry and the forecasting of timber markets, comparing approaches, like getting a second opinion, strengthens our collective understanding, even while exposing uncomfortable truths. To start, results must make sense, and they must align with the strongest, available, verified facts.
Consider the accumulation of forest supplies in the U.S. South. We have written about the broader forest supply-wood demand story before, and how the South now has a higher baseline forest inventory. Here I focus on the dynamics of planting (supply) and harvesting (demand) trees, which drive the forest cycle in active, private markets for wood and timber.
The age structure of today’s forest inventory reflects the timing and responses of past policy and market surges and flows (Figure 1). The first surge in planting in the 1950’s corresponds with the Soil Bank Program, and the second wave of activity in the 1980’s ties to the Conservation Reserve Program (CRP), in which the USDA encouraged landowners to plant trees on former fields and agriculture lands. Timber rotations in the South average 25-30 years, and the recession affected the planting cycle by aligning with the arrival (the “echo”) of the CRP-subsidized plantations from the 1980s. The effects magnify each other, as a major decrease in harvesting activity fed already strong inventories planted 30 and 60 years ago as part of federal incentive programs.
Figure 1. Southern Tree Planting, All States and Ownerships
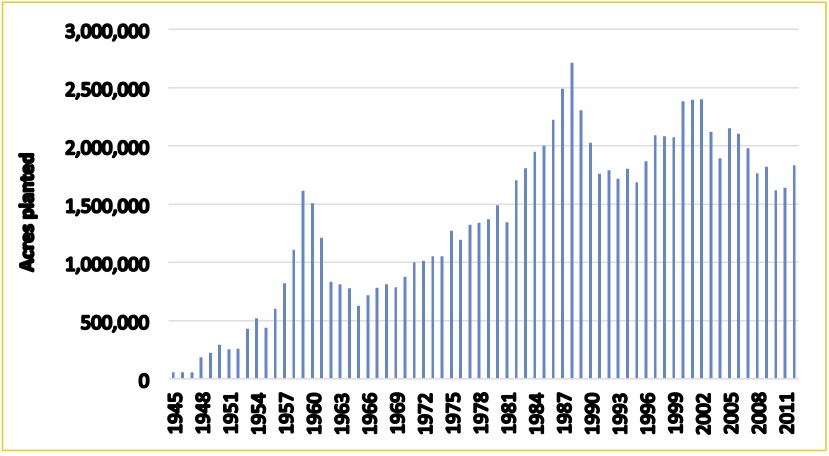
Figure: Forisk Research Quarterly, Q3 2015; Data: A Statistical History of Tree Planting in the South 1928 to 2012, G. Hernandez and R Harper USDA Forest Service.
What does this mean? It’s the Baby Boomer Generation of tree growth. The demographics and population dynamics of the forest have a pattern. Any projection that fails to account for the “pig in the python” of tree planting fails basic reason. We planted a lot of trees, and we deferred a lot of harvesting. And tree growth, like money in a savings account, compounds.
The implications vary by state and local market. While states such as Georgia and Texas with sawmills closer to end markets have seen harvesting and wood flows increase along with improved housing markets, Gulf and Central States such as Louisiana, Mississippi and Alabama, with smaller populations and less home construction, have lagged. As an example, let’s look at the harvest patterns for pine grade in Mississippi and the actual wood flows to assess the current baseline.
According to US Forest Service data, Mississippi had about 108 million tons of private pine sawtimber inventory on private timberlands in 1977 (and 133 million tons of pine pulpwood). This pine sawtimber inventory grew to about 135 million tons by 2007, to 180 million tons by 2011, and to 258 million tons by 2015. Is this reasonable for estimated pine grade inventories to have increased 91% (123 million tons) over an eight-year period? What do the facts associated with planting and harvesting say about the potential for pine grade inventory growth averaging 15 million tons per year or more in Mississippi?
Planting (supply): Mississippi significantly increased its participation in the CRP program in the late 1980s, going from 81 thousand enrolled acres in 1986 to over 701 thousand acres by 1990, an annual growth rate exceeding 50%. That helped put a lot of new trees in the ground.
Harvesting (demand): Mississippi markedly reduced harvest levels during the recession (Figure 2). In the decade prior to the recession, Mississippi averaged over 16 million tons of pine grade annually. The state was a forest industry powerhouse. Following the recession, average harvest levels declined to nearly half those levels, implying a harvest deferral of over 7.7 million tons per year.
Figure 2. Annual Pine Grade Use and Implied Harvest Deferral, Mississippi (tons)
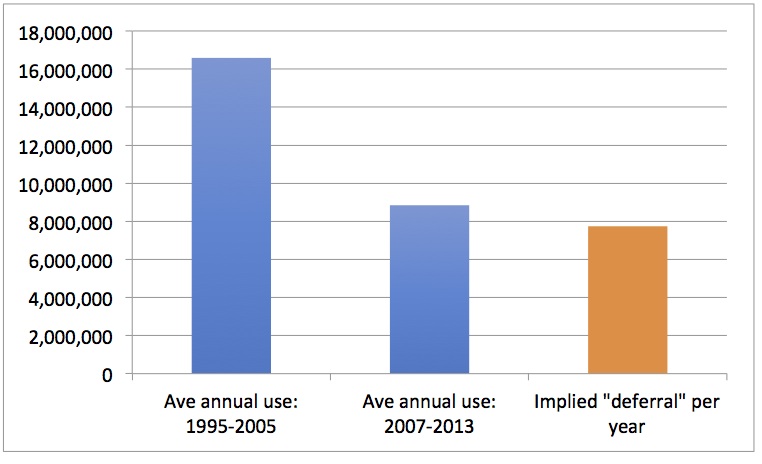
Sources: US Forest Service TPO; Forisk
So what do the physical facts associated with deferred harvests imply for total forest growth in Mississippi? Assume we averaged 7.7 million tons of deferred harvest per year from 2007 through 2016. And like money in a savings account, deferred harvests can grow at a compounded rate (Figure 3). Delayed harvests, juiced by previous planting and “in growth” (younger trees moving up through the product classes), and allowed to compound provides a physical story, regardless the assumptions on conversion rates or parcelization or logging capacity. US Forest Service data confirm forest growth rates of 4% or 6% or 8% or more, depending on the specie, owner, location and timeframe. And assuming 8%, we have a story growing Mississippi’s pine grade inventories at 15 million tons per year.
Figure 3. Implied Accumulation of Deferred Pine Grade Harvest, Mississippi (tons)
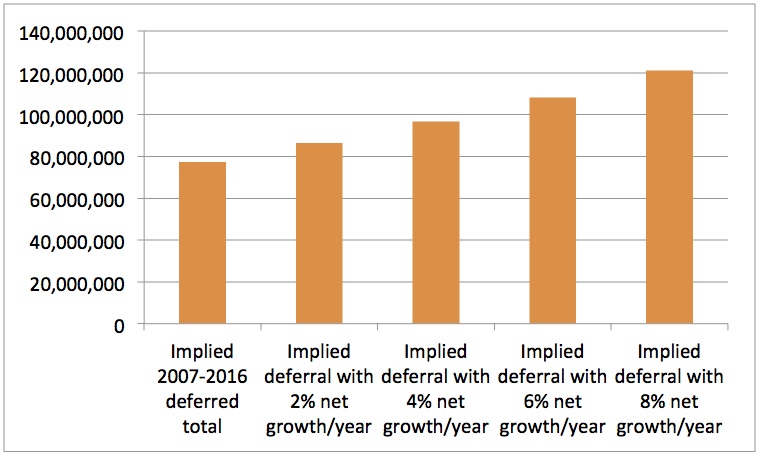
Source: Forisk
Over time, we have stripped down and simplified our forecast models to the core drivers, building on knowable physical facts that produce “transparent” results. Transparency, in this context, means the results clearly and directly tie to what we know about how things work on the ground, such as planting and harvest patterns. A complicated or sophisticated model, for these applications, may or may not clarify key drivers. The goal of the exercise is to support decision making through a better understanding of how changing supplies affect timber prices and wood costs.
A common response to “why invest in timberland?” is that long term results are rarely negative – in nominal or real terms. What are the TIMOs telling their investors whose properties were purchased with higher stumpage return expectations? How long can they afford to wait for the demand to absorb a growing supply?
In forestry, trees planted years ago give us the forests we have today. Waves of trees can grow in massive booms. Foresters call this “a wall of wood” or “the pig in the python.”
To Tom’s question I suspect the TIMO investors will wait until they can find an equally sound (or unsound?) investment which provides a better “advertised” or promoted or calculated return on investment.