This is the second in a series that shares insights from a decade of research related to North America’s wood bioenergy sector. Part I introduced core themes and wood pellets.
Overview of the U.S. Wood Bioenergy Sector
North America’s forest industry has over 770 million tons of wood using capacity. Of this, approximately 39 million tons (5.1%) are associated with wood pellet plants. In the United States alone, the wood bioenergy sector – which includes pellets, combined heat and power (CHP), wood electricity, and liquid fuels – accounted for over 70 million tons of wood use in 2018, much of it in the form of manufacturing residuals and hog fuel.
Some sub-sectors are more stable than others. In 2017, wood biomass accounted for 1.0% of total U.S. electricity generation, reinforcing its role as a reliable, though small, component of U.S. power (Figure 2). The 41.2 million megawatt hours generated that year represented a 0.5% increase from 2016 and was 5.5% higher than in 2007.
Figure 2. 2017 U.S. Electricity Generation by Fuel Type

Sources: EIA, Q1 2019 FRQ
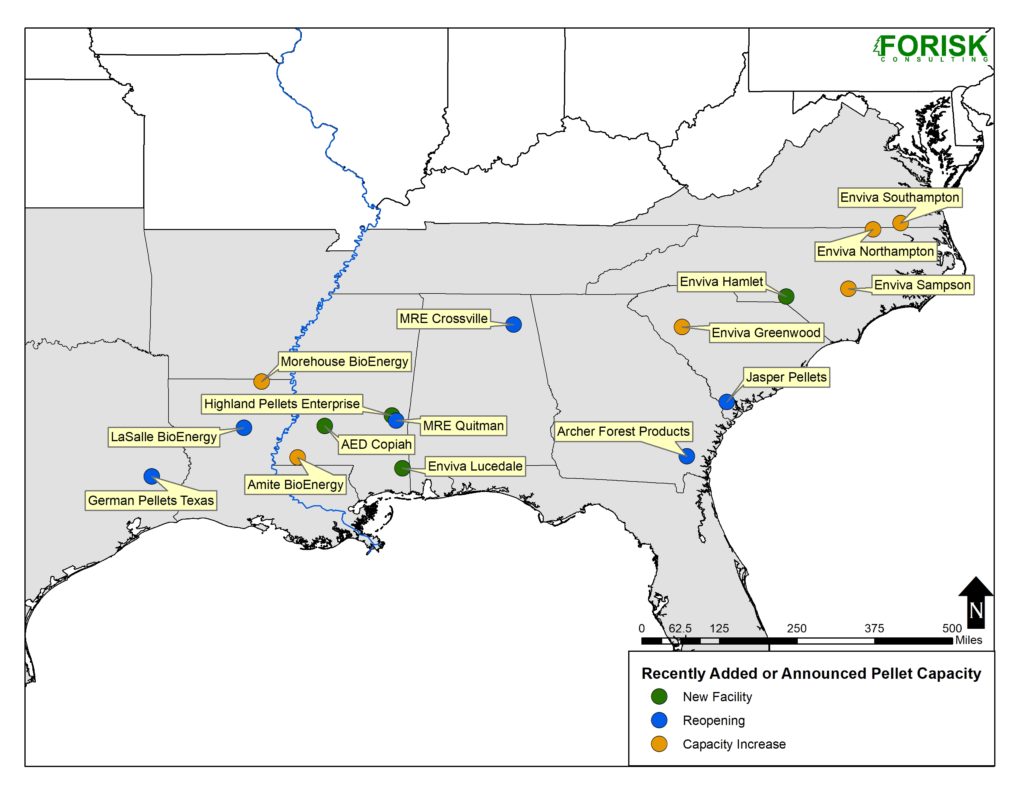
Meanwhile, wood pellet markets continue to grow and attract capital. Wood pellet production capacity in North America increased 170% over the past decade. Growing to meet European demand for renewable energy – and more recently demand from Asia – wood pellet manufacturers consolidated and shifted across regions. And larger projects continue to locate in the South, which is the largest wood pellet producing region in North America (Figure 3).
Figure 3. Recently Added or Announced Viable Pellet Capacity in the U.S. South

Source: Forisk
Lessons from Wood Pellets on Risk and Context
Our research highlights several insights from wood bioenergy relevant to strategy development and risk management in the forest industry. The first one:
Have a Simple Screening and Ranking Process
Without a structured approach to ordering the world, the world will impose its views on us. The fact is some things are more important than others, some things are easily verifiable, and some things depend on others. We have “nice to have” and “need to have.” There are “necessary” conditions and “sufficient” conditions. Simple processes help us sort the mess and prioritize.
For example, we apply simple screens each quarter to the wood bioenergy sector to sift out speculative projects. As of January 2019, Forisk tracked 437 operating and announced bioenergy projects. These represent potential wood use of 114.8 million tons per year. Our analysis suggests 156 of these projects (35.7%) will fail, implying wood use from bioenergy in the U.S. of 80.8 million tons by 2028.
Our screen poses two answerable questions. First, does the project rely on a proven technology? “Proven” is one that operates at full commercial scale, preferably for a year or longer, anywhere in the world. Second, has this project secured at least two of the necessary resources or agreements such as financing; air quality permits; engineering (EPC) contracts; power purchase agreements; or raw material supply agreements?
While there are other considerations, this approach has proved useful in systematically distinguishing probable from speculative projects.
In the forest industry, we apply simple screens to “at-risk” mills and newly announced mills, to evaluate wood baskets and operable forest supplies, just as we scan the posted health scores at any restaurant we enter. They don’t tell us everything, but they tell us something that focuses the mind and reorders follow-up questions.
We all apply screens in our lives. Does he tell the truth? Does this house have three bathrooms? Does this car have a big enough trunk for my flux capacitor? The key is to apply these screens consistently, systematically and then revise based on back-testing performance over time. That’s how we learn and improve.
In Part III, we share a lesson related to context.

Brooks – Thanks for sharing the questions you use for screening project risk. There’s a lot of wisdom there in simple form.