Every year around the holiday season, the forestry world anxiously awaits the arrival of more than just a few days of vacation and myriad off-key renditions of Auld Lang Syne. Each December, the Bureau of Labor Statistics releases the year-end injury and fatality statistics. And each year logging occupations are highlighted as a top 3 dangerous occupation. Often, newspapers label it the “Most Dangerous Job” in the U.S. For those of us who spend considerable time in and around the industry, it is a disappointing label reflecting an industry detached from the modern, mechanized logging workforce that harvests the majority of wood in the U.S. today. Still, numbers don’t lie (well, usually) and the numbers tell a sobering tale.
Since the start of the 2000’s, nearly 1,700 logging employees lost their lives on the job. Over 60% have been timber fallers, an increasingly rare occupation as mechanized felling machines supplant men with chainsaws, yet still the highest risk role on a logging operation. Transportation-related fatalities comprised 20%, many of them truck drivers, though a large portion resulted from injuries to other employees by logging vehicles. The details of each fatality certainly matter, yet the sum is staggering for an industry of only 50,000 employees. The logging industry has an impressive story to tell in terms of improving safety, yet these statistics tell a different story. Why?
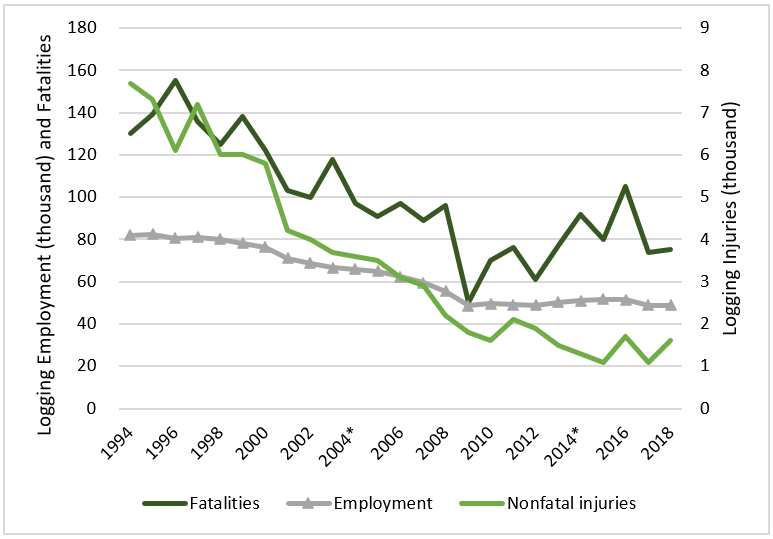
* Nonfatal injury data in 2004 and 2014 not separately reported for the logging industry
Looking at the numbers, both fatalities and nonfatal injuries dropped substantially since the mid-1990’s, as the forest industry devoted considerable effort to training and improving safety. Nonfatal injuries fell from over 7,000 per year to less than 2,000. Fatalities also declined, though not to the same degree, from around 140 per year to 80. The higher proportion of employees in equipment certainly helped reduce injuries in the industry, and fatalities have declined. Yet the logging industry has also been shrinking. In the 1990’s, the logging industry employed 80,000 people, today it employs 50,000. The drop matters when counting injuries.
* Nonfatal injury data in 2004 and 2014 not separately reported for the logging industry
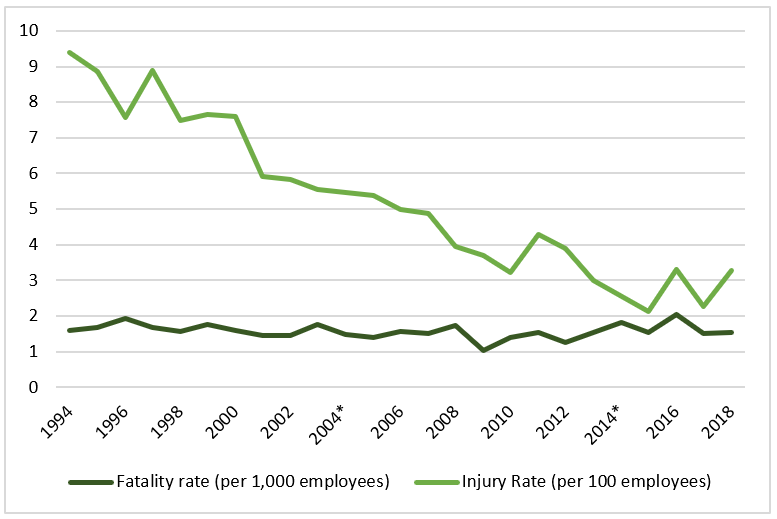
Comparing injury and fatality rates provides the context we need to understand some of the major trends. Nonfatal injury rates fell from 9 per 100 workers in the mid-90′, to 3 per 100 workers as we approached the end of the 2010’s, an amazing reduction. The drop in injury rates highlights the improvement in safety and the lower likelihood of being injured as a logger. Yet fatality rates fluctuated within the same range for the past 25 years. From 1994 to 1998, the industry averaged 1.68 fatalities per 1,000 employees. From 2015 to 2018, it averaged 1.66. The chance of being injured is lower yet the chance of being killed has not changed.
This winter, the workplace fatality press release will come out again, and newspapers will highlight the most dangerous jobs. I’ll cross my fingers and hope that no loggers have lost their lives, so logging never rejoin the ranks of “Most Dangerous Job”. It would be a well-deserved holiday gift for the industry.
Fatality data from BLS Census of Fatal Occupational Injuries, nonfatal injuries from BLS Industry Injury and Illness Data, and employment levels from BLS Quarterly Census of Employment and Wages. Rates were calculated from injury counts divided by employment level, rather than using published rates based on estimated full-time employee equivalents (FTE).
Leave a Reply