This post is the fourth in a series related to the Q1 2023 Forisk Research Quarterly (FRQ). It references our featured research on pulpwood and sawtimber price drivers.
Each year we evaluate our forecast models to understand what went well and what did not in hopes of improving. What sources of error might drive wood prices in a given market? As part of this exercise in 2017, we highlighted the growth in “removal years[1]” of southern pine sawtimber inventory and questioned a significant sawtimber price appreciation while inventory remained elevated relative to removals. In that discussion, we provided the figure below with a sawtimber price forecast range through 2026 based on our expectation for lumber production and inventory growth. The last six years of actual South-wide pine sawtimber prices and lumber production clarify how this simple metric performed.
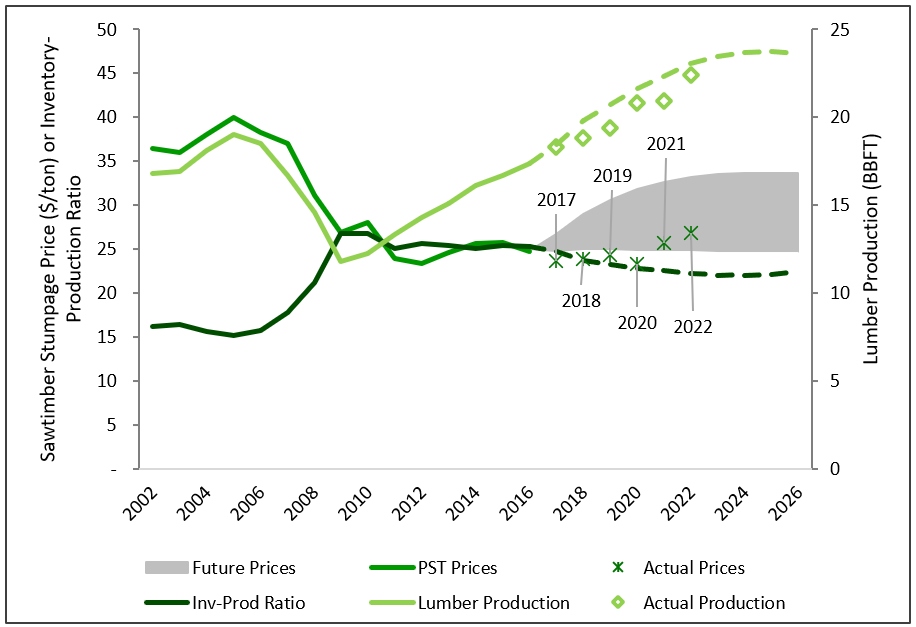
Our lumber production forecast was largely in-line with actual industry growth. We forecast 22.3 BBFT of southern lumber production in 2021, a level the South was on pace to produce in 2022. Yet inventories accumulated more than we anticipated. We forecast a 3-year reduction in sawtimber removal years, while our most recent estimates suggest we reduced by only 1.5 years. Still, sawtimber removal years remain well above levels prior to the Great Recession and price growth remains sluggish. Over the last two years, pine sawtimber prices increased into the low end of our outlook range.
We revisited this analysis in our Forisk Research Quarterly feature article this quarter along with state-by-state reviews of pulpwood and grade price-to-demand relationships over the past eight years. Are removal years at the state level a reliable indicator of strong price responses to demand? The take-home message remains the same; large and growing inventories constrain price appreciation. While prices are increasing in a number of local markets, we continue to forecast inventory growth across many southern states.
[1] Removal years measures the current inventory of a product as a ratio of the total removal volume of that product. If we have 1 million tons of sawtimber in inventory and are currently harvesting 100,000 tons per year, we have 10 removal years of inventory.
Leave a Reply