This post is the second in a series related to the Q4 2023 Forisk Research Quarterly (FRQ), which includes forest industry analysis and timber price forecasts for North America.
Real estate investment trusts (REITs) own and manage income producing real estate such as buildings, bowling alleys, warehouses, and, since 1999, timberlands. Buying shares of timberland-owning REITs provides one way to add exposure to timber, wood products and housing to an investment portfolio in a relatively tax-efficient way. Currently, the publicly traded timber REITs include:
- PotlatchDeltic (symbol: PCH);
- Rayonier (symbol: RYN); and
- Weyerhaeuser (symbol: WY).
Timber REIT Performance
The Forisk Timber REIT (FTR) Index, commonly called the “footer index,” is a market capitalization weighted index of the public timber REITs. Initiated in 2008 along with the FTR Total Return Index, the FTR Index provides a useful benchmark for comparing timber REITs to other timberland investment vehicles or to the overall market. The figure below provides summary analysis of the timber REIT sector and individual timber REITs relative to other asset classes through the first three quarters of 2023.[1]
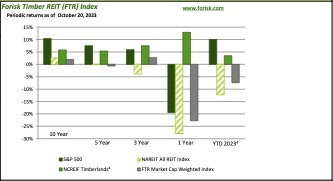
Year-to-date 2023, as of the week ending Friday October 20th, the FTR Index returned -7.43% versus 10.02% for the S&P 500. Currently, publicly traded timber REITs account for about 2.6% of the total market cap for all public REITs.
Notes on Estimating Net Asset Values (NAVs)
When deciding whether to accumulate or dispose of timber REIT shares, investors value them. The challenge is having a reliable and systematic method for assessing when they are over or underpriced relative to their net asset values (NAVs). Valuing timberland investment vehicles is a function of estimating and, ultimately, discounting cash flows. If a timber REIT exhibits strengthened cash flows over time, this leads to expectations of higher distributions and higher share prices.
Of the three public timber REITs, only Rayonier, since spinning off its pulp mills into Rayonier Advanced Materials (RYAM) and selling its sawmills to Interfor, trades as a “pure” timberland firm. PotlatchDeltic and Weyerhaeuser both own wood-using manufacturing facilities. To value non-timber manufacturing assets, analysts apply approaches including:
- Auction value: essentially, what is the “scrap” value or liquidation value of the machinery, steel, concrete pad, and other elements associated with the site and facility? This approach, when applied, provides a floor for cases when mills are viewed as extraneous to the core business.
- EBITDA multiples: value the business segments by using market-based multiples of estimated earnings for those manufacturing sectors.
- Facility production values: value manufacturing facilities based on the market value of the annual production. This includes multiplying the stated capacity of the site or mill type by the per unit price of the product being sold.
For the timberlands, we employ several approaches, partly depending on data availability and the level of “precision” required, when assessing net asset values (NAVs). These include:
- Implied market values: subtract the estimated values for all non-timber assets from the firm’s total market capitalization and then dividing this by the acres owned to provide a starting point for how the prevailing public markets value owned timberlands.
- Regional index values: apply regional timberland values from the National Council for Real Estate Investment Fiduciaries (NCREIF) to timber REIT acres by U.S. region. This approach supports baseline analysis published in the Forisk Research Quarterly (FRQ) as it captures the general region-specific trends for timberland values.
- Localized asset analysis: this hybrid sum-of-parts approach includes (1) segregating timberlands, at a minimum, at the state-level or, preferably, into market-relevant units; (2) modifying baseline timberland values (from NCREIF) by applying, when available, market-specific comparables; and (3) adjusting these values based on market-specific recovery rates for wood demand and timber prices.
Conclusion
Ultimately, investors attempt to identify timber REITs that are trading below estimated NAVs. The divergence between price and NAV could be a function of a lack of understanding of the specific properties, poor current market conditions, or unattractive balance sheets. This is a key theme with respect to timber, as the longer-term prospects of a given firm are tied to longer-term cycles in housing, demographics and consumer goods.
#
[1] To subscribe to the free weekly FTR Index Summary and to obtain historical FTR Index data in an Excel format, please contact Pamela Smith, psmith@forisk.com.
Leave a Reply