This post is the second in a series related to the Q1 2024 Forisk Research Quarterly (FRQ), which includes forest industry analysis and timber price forecasts for North America.
Introduction
The U.S. Forest Service Forest Inventory and Analysis (FIA) program released a new modeling system in September 2023 to estimate tree volume and carbon, the National Scale Volume Biomass (NSVB) models. USFS FIA developed this system to have nationally consistent and accurate methodology to estimate tree volume and carbon. New applications of FIA data, including reporting of greenhouse gas inventories, carbon estimates, and research on old growth and sustainability topics, raised the need for accurate reporting of whole tree biomass. Previously, tree volume equations varied by region, with some equations derived from limited datasets. To develop new models, USFS scientists and partners introduced new data and used new model building techniques.
Previous analyses of timber supplies by Forisk used older FIA models. Timberland owners and forest products manufacturers want to understand the impact of new models on estimates of wood volumes and timber market analyses.
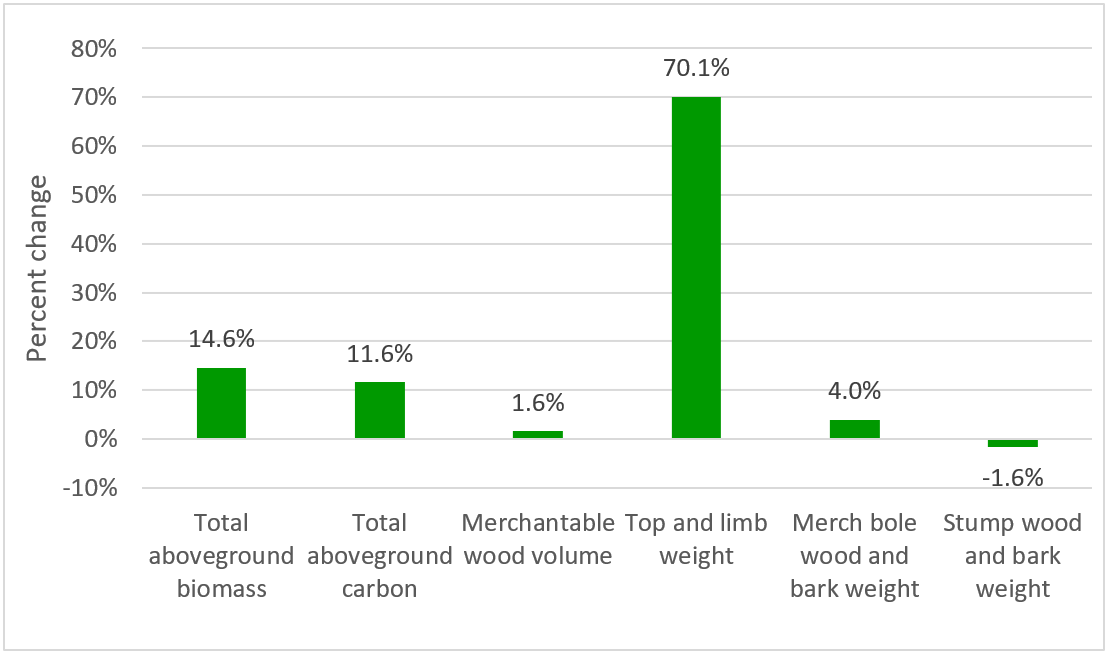
Overall, merchantable wood (stem) volume used by forest industry mills only increased 1.6% in U.S. forests due to new model updates. Most of the change from the new models was in top and limb weight, which increased 70% relative to previous models. Specific impacts vary by tree species and geography.
This blog quantifies impacts of the new models on pulpwood and sawtimber inventory estimates in the U.S. South.
Data and Findings
The model changes reduced total merchantable pine inventory in the U.S. South by 0.2%, using 2019 data as this is the latest year for which all states in the region have estimates. Florida (-3%) and Tennessee (+3%) had the most change, with the rest of the states ranging from -1% to 1% changes from the new models. New models increased the merchantable hardwood inventory 5% in the U.S. South. Tennessee had the largest increase by 13%, followed by Virginia (+6%), Arkansas (+5%), and Alabama (+5%).
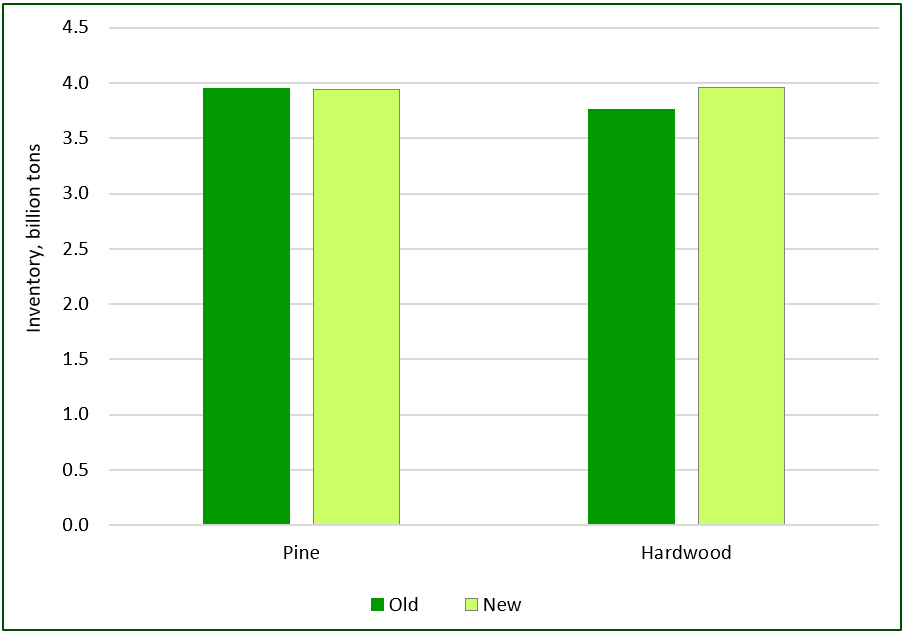
Figure 2. 2019 Merchantable Pine and Hardwood Inventories in U.S. South from Old vs. New (NSVB) Models. Sources: USFS FIA, Forisk Consulting.
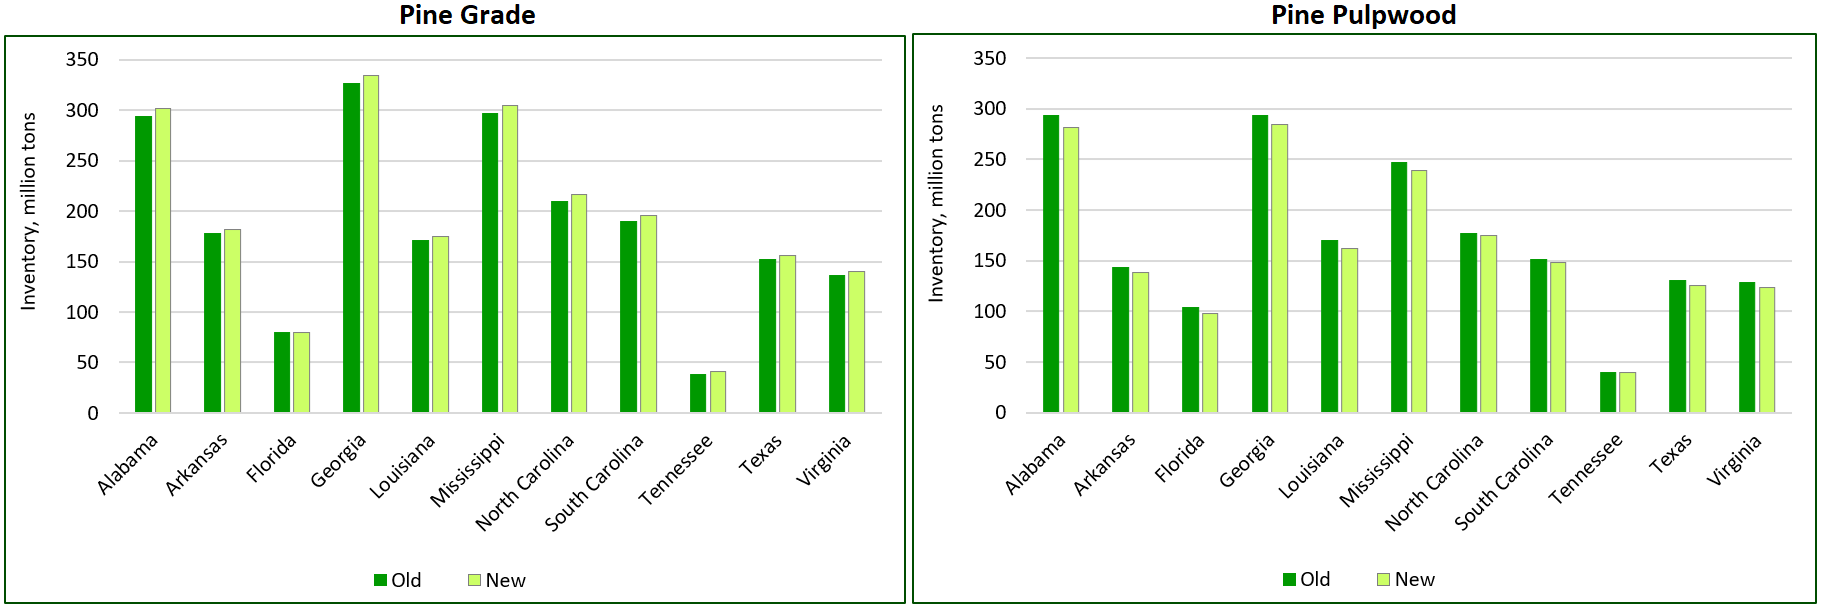
For pine, the new models generally decreased inventory estimates in smaller diameter classes and increased estimates in larger diameter classes. Pine grade inventory in the South increased 3% from the new models, with the biggest change in Tennessee (7%) and the smallest change in Florida (1%). Pine pulpwood inventory in the South decreased 3% from the new models, with the biggest changes in Florida and Louisiana (-5%) and the smallest change in Tennessee (-1%).
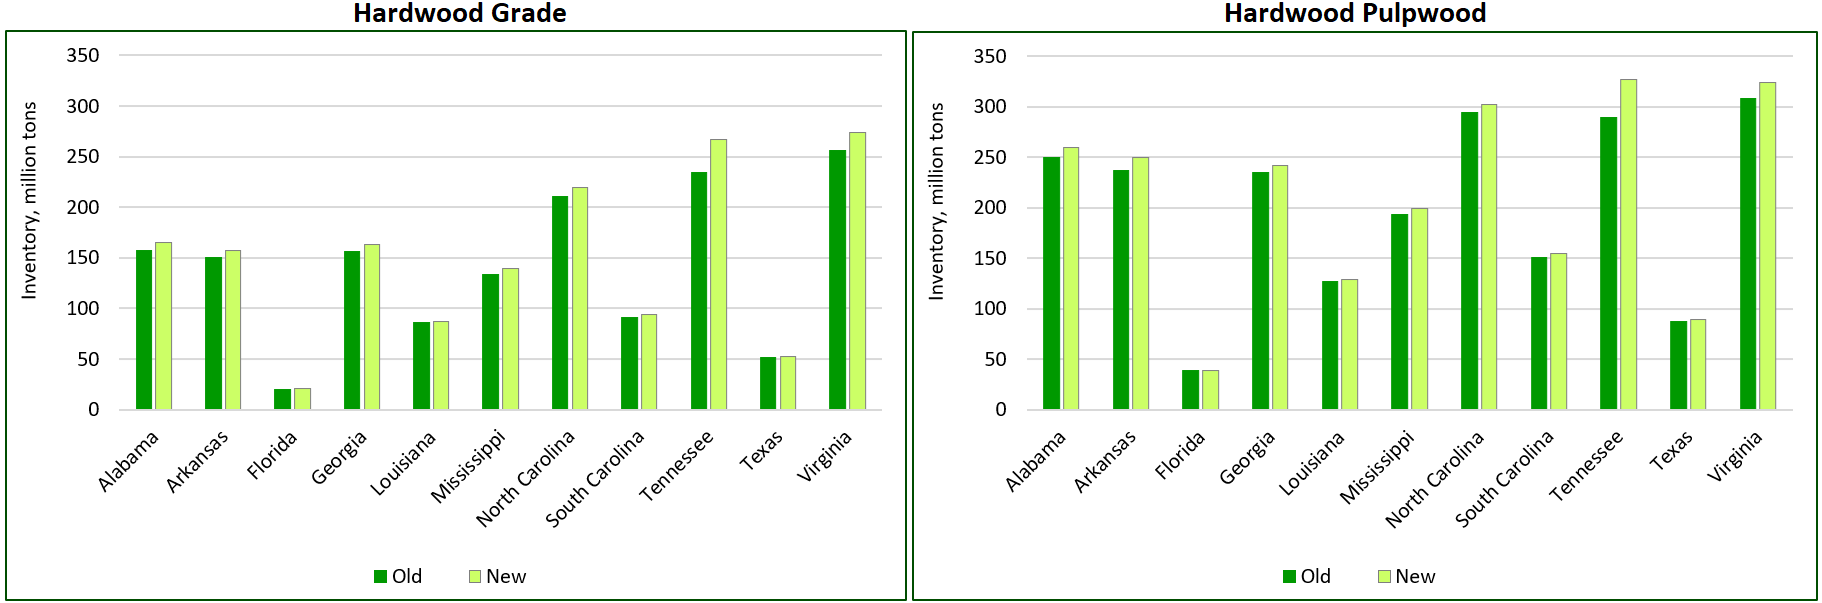
For hardwood, the new models generally increased inventory estimates in all diameter classes. Hardwood grade inventory in the South increased 6% from the new models, with the biggest change in Tennessee (14%) and the smallest change in Louisiana and Texas (2%). Hardwood pulpwood inventory in the South increased 3% from the new models, with the biggest changes in Tennessee (13%) and the smallest change in Louisiana (1%).
Implications
Given the small scale of the change in merchantable timber volume, the NSVB models should not materially impact timber inventory assessments in the U.S. South.
Matt Camp, Forisk Project Manager & Consultant, contributed to the research in this blog post.
To learn more about the Forisk Research Quarterly (FRQ), click here or email Heather Clark at hsclark@forisk.com.
It would have been nice to have a graph that showed the total “above ground” biomass and the total “below ground” biomass as well as a graph showing the same for total carbon above and below ground to help us better understand carbon storage in our forests. Thanks George Delisle
George, thank you for the note. This website includes state reports (at the bottom) that show changes to aboveground biomass and other biomass types: https://charcoal2.cnre.vt.edu/nsvb_factsheets/index.html. Hopefully this gives you some additional information on the biomass changes.