This post is an excerpt from the Q4 2025 Forisk Research Quarterly (FRQ), which includes forestry industry analysis and timber price forecasts for North America. To learn more about the Forisk Research Quarterly (FRQ), click here or email Nick DiLuzio at ndiluzio@forisk.com.
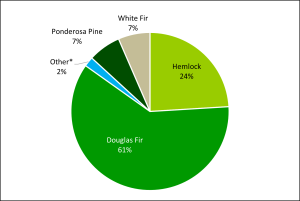
Forisk intern, Gracie Knight, collected 2023 and 2024 sawmill data from Oregon’s air permit database, including lumber production volumes by species and residual by-product production. For the two survey years, Douglas-fir represented 61% of Oregon lumber production with Hemlock-fir the second most common species at 24%. Ponderosa pine and white fir each comprised around 7% of total lumber production with a mixture of other species including western red cedar and lodgepole pine comprising the remainder.
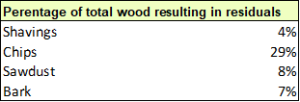
Combining data from the air permit reports with Forisk’s North American Mill Capacity Database, we estimated the proportion of incoming raw material converted to residual byproducts. Log volumes were converted to tons using an average of 7.5 tons per MBF. Residual totals were then estimated by product categories including shavings, sawdust, bark, and chips. The data indicates that 52% of the log volume processed at sawmills in Oregon is sawn into lumber. The remaining 48% becomes residuals. Roughly 4% of the volume entering a sawmill in Oregon exits as shavings, while 29% end up in chips with 8% and 7% of the volume converted to sawdust and bark, respectively.
Leave a Reply