This post includes content from the Q3 2025 Forisk Research Quarterly and ideas covered in the virtual Timber Market Analysis class, offered on October 1st and 2nd, 2025.
Introduction
Sports offer fans familiar mathematical benchmarks and ratios. In professional baseball, great batters hit safely three times out of ten (meaning they fail 70% of the time). In basketball, good shooters make 80% of their free throws (and great shooters hit 90%). Did you know that most points in a tennis match end in errors and not winners? From amateurs to professions, two-thirds to three-quarters of all points played end with the ball long, wide, or in the net.
Similarly, forestry and timberland management offer investors useful reference points and ratios for understanding the current situation and making decisions.
Premiums and Timber Price Ratios
Over time, delivered log and stumpage prices feature various “premiums” across products. For example, previously in the Pacific Northwest, we commonly observed premiums for the higher quality exported Douglas-fir logs headed to Japan. In 2015 issues of the Forisk Research Quarterly, exported D-fir logs in the Pacific Northwest had average premiums of 30% over the #2 domestic Douglas-fir sawlogs delivered to sawmill in Coastal Washington. In 2024, according to data from the Wood Fiber Review, this average premium was down to 13%.
In the South, the value relationship between timber products is sometimes communicated as a multiple or a ratio. This language is specific to pine, which benefits from a range of diverse applications that can make use of the smallest, younger trees up to the largest, stoutest specimens. With so many changes in forest inventories, sawmill technologies, and pulpwood markets over the past ten and twenty years, let’s review how these product price relationships have changed.
Figure 1 summarizes the ratio of pine sawtimber-to-pulpwood prices from Timber Mart-South for 2005, and 2015, and forecasted by Forisk for 2025. Experienced timberland managing clients in the South sometimes speak of the “four, five, or six to one ratio between prices for logs and pulpwood”, and we see this in the numbers from 2005, with sawtimber exceeding pulpwood on average by more than 5 times, as prices and values were running up to the 2007-2009 Great Recession.
Figure 1. Southwide Timber Product Price Ratios: 2005, 2015 and 2025
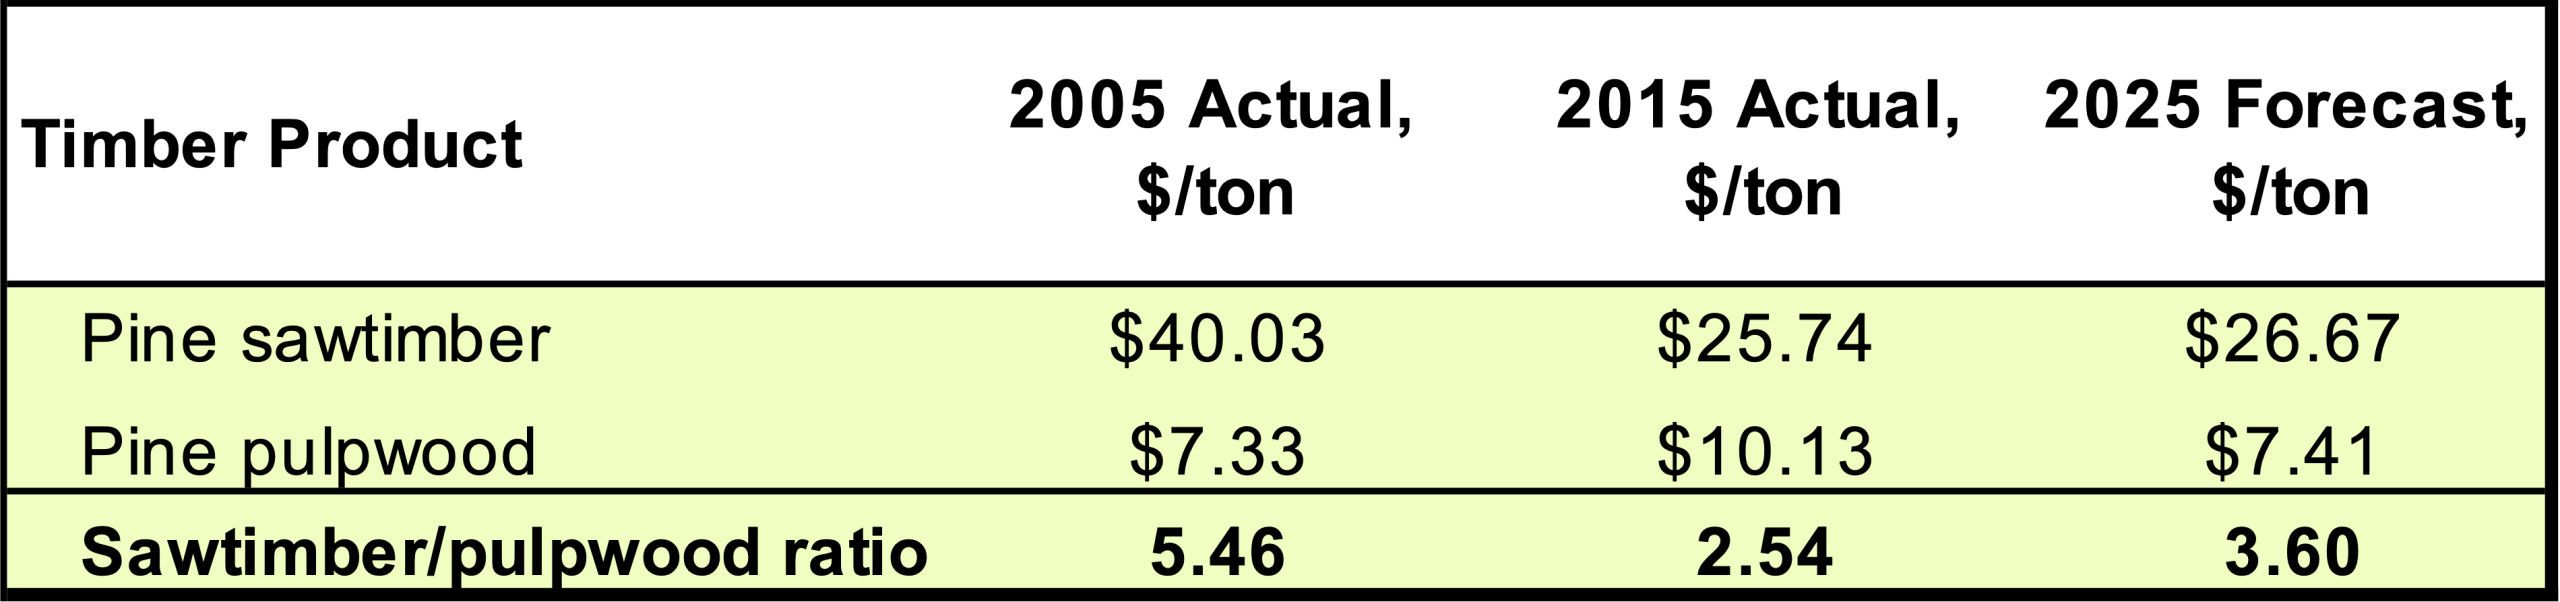
Data sources: Timber Mart-South; Forisk Research Quarterly
Following the Great Recession, this ratio collapsed with sawtimber prices. However, its role remains important, as the relationship between pine sawtimber prices and those for pulpwood reinforced the reasons why landowners managed for pine sawtimber instead of just maximizing volume on shorter pulpwood rotations. The incremental value for sawtimber, reflected in the multiple and the underlying financial math, justified a sawtimber forest management strategy as along as that ratio exceeded 2.5 or 3, which compensated landowners for the additional investment of time.
Current Situation
Recently, we have seen the ratio reassert itself, as sawtimber prices inch their way up and pulpwood prices continue to fall. In response, as reflected in results from Forisk’s Silviculture Surveys over time, we see forest owners reducing their trees planted per acre and decreasing their thinning harvests from two to one, while remaining committed to the goal of growing sawtimber.
Leave a Reply