“Better a diamond with a flaw, than a pebble without” – Confucious
No measure is perfect. BMI, EBITDA, OPS+, all of these provide a relatively simple picture of something: weight, earnings, or offensive production. None of them tells the whole story on their own, though. They provide context to differentiate a group of otherwise similar things. Measures are simplifying and helpful so long as you understand their limitations.
As part of our recent multi-client study, we scored markets in the U.S. South and Pacific Northwest – 30 markets in the South and 7 in the Northwest – from three different perspectives: timberland investors, sawtimber consumers, and pulpwood consumers. Market scores comprise measures of physical timber supply and demand, and a set of risk factors. In an effort to make comparisons between markets simpler, we limited each score to 5-8 total criteria. No single measure was perfect, but all spoke to a specific facet of the market, current demand, future supply, risk from competition, etc.
One common measure of relative supply, growth-to-drain, relies on data from the U.S. Forest Service. It provides a current snapshot of how “balanced” the supply is to demand using the volume of harvest removals relative to the annual growth. Regional disparities in how data is collected (more frequently in the South than the West) and market dynamics (i.e. more public timber in the West vs. limited supply in the South) require a different approach to estimating relative supplies in the West vs. the South. To provide a current snapshot of available supply in the West, we instead calculated the proportion of sawtimber demand met by harvests within each market. If harvests from public land or wood from outside the market are needed to meet current demand, timberland owners should be in a favorable position, as demand from private land should be high. We used public harvest data from the Oregon Department of Forestry and Washington DNR in combination with Forisk’s wood demand derived from our North American Mill Capacity Database.
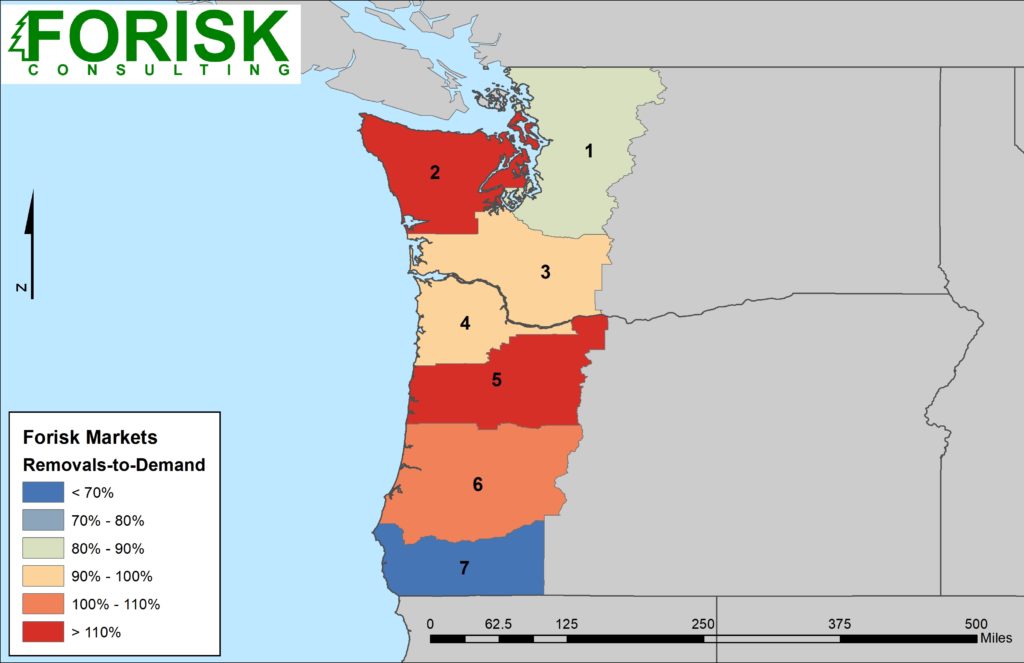
The figure above reveals a reasonable amount of variation in the proportion of softwood sawtimber demand met by harvests from private land only. Market 2 on the Olympic Peninsula and Market 5, in Northern Oregon, demonstrate a surplus without considering public timber sales. This could be beneficial from the perspective of wood buyers. Meanwhile, Markets 1 and 7 are more constrained when considering private timber alone. Timber from public lands represented 21% of the total harvest volume across the Pacific Northwest region in 2018. Adding public timber removals, only Market 7 remains materially constrained relative to demand.
This post includes an excerpt from Forisk’s Multi-Client Study: North American Forest Market & Industry Rankings, a comprehensive analysis and rankings of North American timber markets and wood-using mills. For more information, click, here.
Leave a Reply