In forestry, as in every natural resource or commodity-producing sector, excess inventories bleed prices. It’s that simple. The market requires lower prices to unload or workout surplus inventory. And anxious forest owners and disciplined log buyers may also realize that prices for end products – lumber, panels and, ultimately, houses – can decline.
How big are excess forest inventories and how long will it take to work through them? As part of Forisk’s multi-client study to rank timber markets, we defined wood baskets based on quantitative breaks in demand across groups of counties. These wood baskets became units of analysis for comparing and projecting supply, demand and risk. The study ranked markets in the U.S. South and Pacific Northwest.
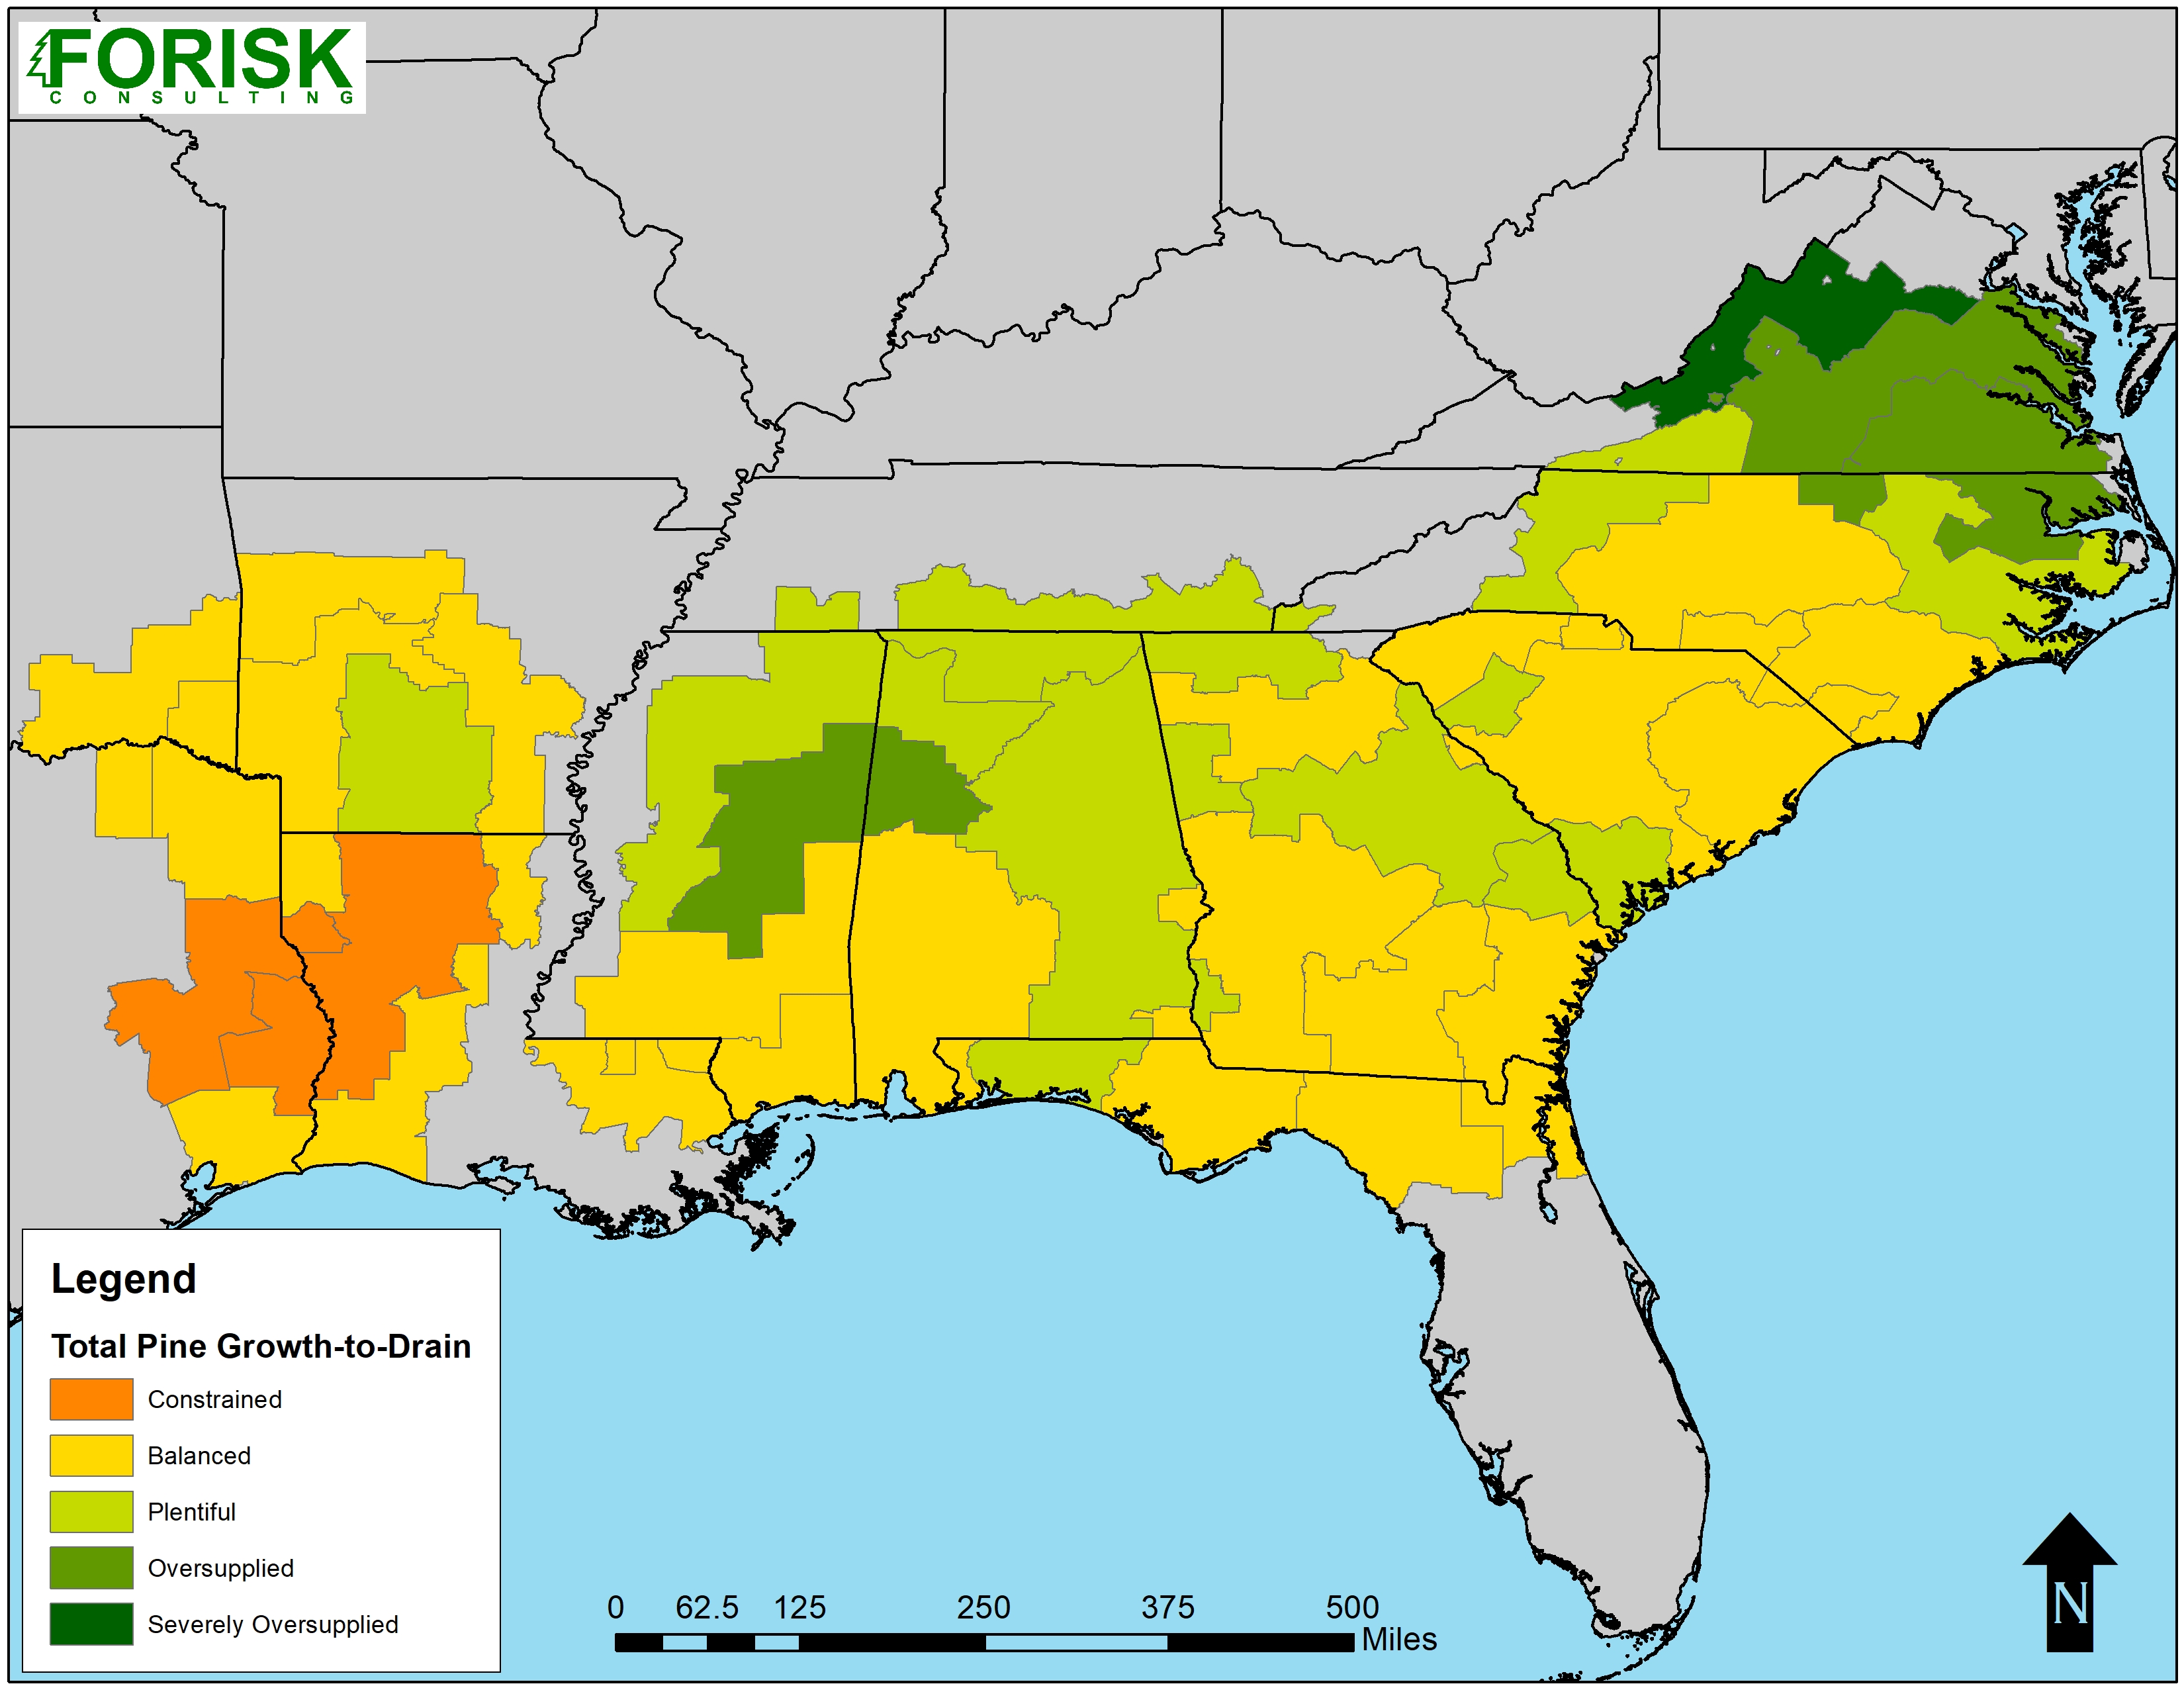
Market rankings must take into account the issues relevant to those deploying capital. For timberland investors, these include the health and diversity of local markets for timber. For wood-using manufacturers, key questions include the availability and sustainability of wood supplies, residual markets, and loggers. As shown in Figure 1, total private pine growth-to-drain ten years in the future paints a “balanced” picture for many markets that, today, look aggrieved to timberland owners. Forisk’s rankings highlight the importance of timing and product specifications.
This post contains research from Forisk’s Multi-Client Study: North American Forest Market & Industry Rankings, a comprehensive analysis and rankings of North American timber markets and wood-using mills. For more information, click, here.
Thank you Ms. Amanda. A similar ranking of the main pine products (pulpwood, CNS, sawtimber) would be interesting as well.