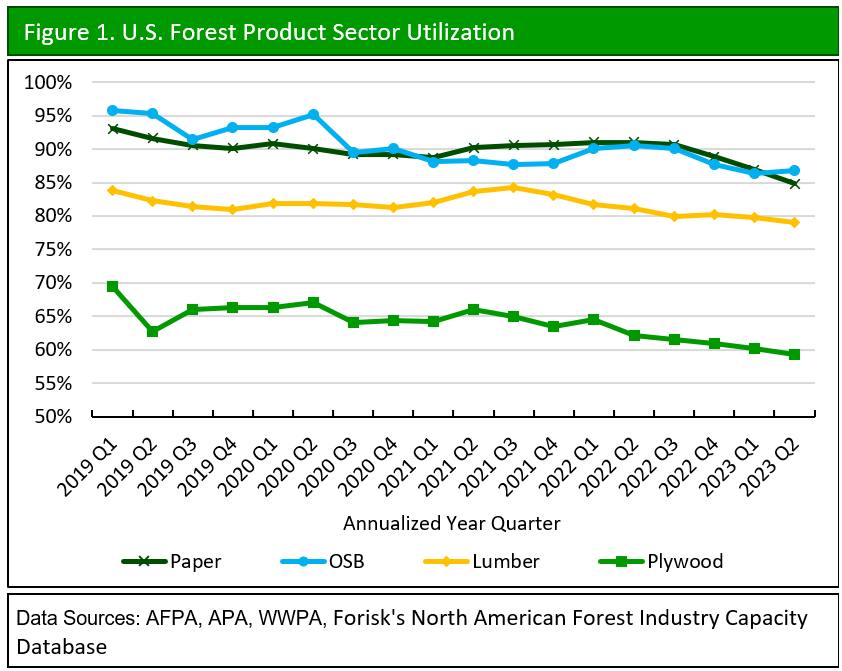
Utilization is the act of making practical use of something. For industrial purposes, utilization is the percent of name plate capacity used to produce a product; it is calculated as production divided by capacity for a set time period. Forisk analyzed mill utilization for four forest products sectors for the last 18 published quarters with capacity data from the North American Forest Industry Capacity Database. Each reported quarter averages the previous twelve months to annualize rates for each sector. Utilization trends show how mills responded to Covid-19 and end-product price shifts.
Covid affected utilization in early 2020. All sectors declined as the virus and mitigation practices disrupted manufacturing across the supply chain for several quarters. OSB and plywood utilization declined 5% and 3%, respectively, from Q2 to Q3 2020 while lumber remained unchanged.
In addition to events like Covid-19, mill operations respond to end product pricing. Softwood lumber prices increased dramatically in 2021 and early 2022, which corresponded with increases in softwood sawmill utilization. Recent trends for OSB and plywood show similar responses to increases in utilization rates by manufacturers during periods of price increases for building materials.
Each sector – lumber, plywood, OSB, and pulp/paper – has declined given softer markets and end-product pricing. For the period of Q1 2019 – Q2 2023, lumber utilization fell 6%, pulp/paper and OSB each dropped 9%, and plywood lost 15%. Recent slowdowns increased for each sector: since Q1 2022 utilization rates for pulp/paper declined 7%, lumber declined 3%, plywood declined 8% and OSB dropped 4%. OSB uniquely gained 1% in the most recent quarter.
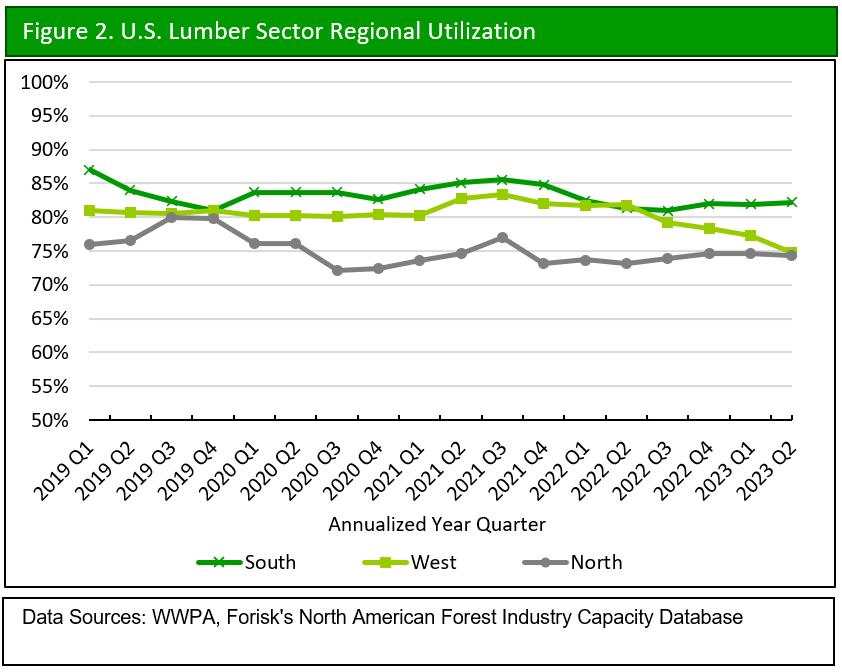
The lumber sector also tells a regional story. Utilization for Northern sawmills fell 2% over the period, while the South and West declined 5% and 8%, respectively. All three regions peaked in Q3 2021, before declining moving into 2022. The South and North then gained over 1% from Q2 2022 through Q2 2023, while the West declined 9%.
For details on mill capacity and to produce custom reports and maps, check out Forisk’s North American Forest Industry Capacity Database. Discounted rates available for companies that also subscribe to the Forisk Research Quarterly (FRQ). Email hsclark@forisk.com for pricing information and to place an order.
Nice work Pat!
Thank you Randy