This post includes data from the Q3 2024 Forisk Research Quarterly (FRQ) and Forisk’s new digital platform for the North American Mill Capacity Database.
Over the past 50 years, major shifts in the regional distribution of lumber capacity across North America followed from natural and legislated disruptions in forest supplies. The details vary, including reduced harvesting on public lands in the Pacific Northwest; insect infestations in Western Canada; and abundant forest supplies and growing markets in the U.S. South. Regardless the motives and explanations, the resulting and massive shift of softwood lumber capacity across North America reminds us that the iron moves to the resource.
Lumber Capacity Changes Over Time: The Data
Since 2009, North America added over 6 billion board feet of softwood lumber capacity, net including closures. This increase of over 9% understates the regional variances, as the South increased by more than 60% (>11 BBFT), Western Canada lost over 25%, and the Pacific Northwest (U.S. West) shrunk by nearly 11%. The U.S. South went from accounting for 25% of North American softwood lumber capacity in 2009 to 38% as of mid-2024. According to analysis by Pat Jolley and Amanda Lang at Forisk, this percentage for the South will grow by year-end simply based on known investment activity.
Lumber Capacity by Region: Current Distribution and Profile
The pie chart summarizes the current distribution of softwood lumber capacity by geographic region. As of July 2024, the U.S. South leads with 38% of North America’s softwood lumber capacity. Adding the U.S. West and Western Canada, which includes British Columbia and Alberta, raises that to 80%. Of all North American regions, these have the merchantable softwood inventories best suited for softwood lumber manufacturing.
North American Softwood Lumber Capacity by Region (as of July 2024)
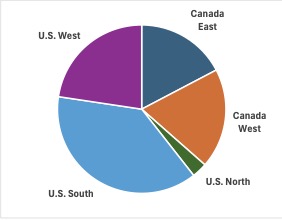
Source: Forisk Mill Capacity Database
The nature and structure of sawmill capacity has changed. The number of sawmills has decreased, and the average softwood sawmill size has increased. While multiple regions have increased capacity – U.S. South, U.S. North, and Eastern Canada – the South is unique with respect to the volume and scale of this growth through the substantial addition of new sawmills.
On this point, scale leverages technological advances in the forest products industry, and industry consolidation further leverages those benefits. The ten largest softwood lumber producers in North America have not changed much with respect to the “who” over the past fifteen years, but their share of North American capacity has increased. In 2009, the top ten went from 28.8 BBFT of North America’s capacity (42% of North America’s total) to 36.9 BBFT today (49% of North American capacity).
To learn more about the Forisk Research Quarterly (FRQ) or the North American Mill Capacity Database, please email Nick DiLuzio at ndiluzio@forisk.com.
Leave a Reply