The following is an excerpt from the Forisk Research Quarterly.
When evaluating timberland investment performance, we generally look at two drivers: EBITDDA (Earnings Before Interest, Taxes, Depreciation, Depletion, and Amortization), which represents the cash yield from operations, and Appreciation, which reflects changes in the underlying land and timber value. Recent NCREIF data highlights a shift in how these two components contribute to total returns across different U.S. regions over time.
Steady Decline of EBITDDA Yields
Historically, investors prized timberland for its steady, bond-like cash flows. However, EBITDDA over the last 30 years has trended downward across all regions.
- Regional Leaders: Historically, the Northwest led in cash yields, peaking at over 10% in the mid-90s and again in 2005. On a 30-year basis, the Northwest maintains the strongest average at 4.8%, while the South lags at 2.8%.
- Convergence: By 2025, regional EBITDDA returns largely converged, with most regions hovering between 1% and 3%.
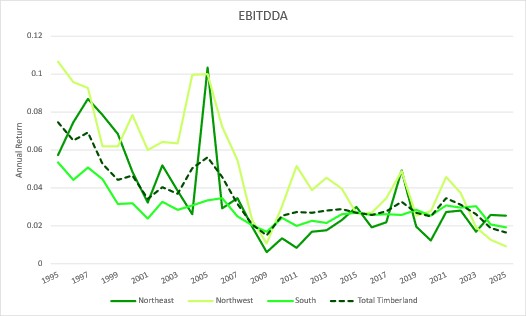
Data Sources: NCREIF Timberland Index
Volatility of Appreciation
Unlike the relatively smooth decline of EBITDDA, Appreciation exhibits sharp peaks and troughs, often corresponding with broader macroeconomic shifts and local log market dynamics.
- Volatility: Appreciation returns have swung from highs of nearly 25% (Northwest, 2005) to lows of -14% (Northwest, 2001).
- Recent Trends: After a post-pandemic surge in 2022, appreciation has cooled across regions, with the Northeast dipping into negative territory by 2025.
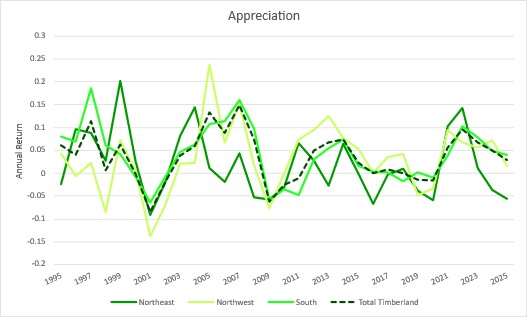
Data Sources: NCREIF Timberland Index
Regional Performance Breakdown
The following table summarizes the annualized returns for EBITDDA and Appreciation over 15-year and 30-year horizons:
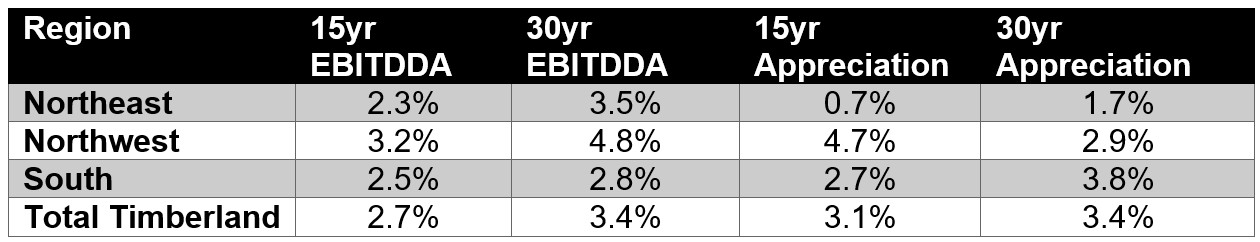
Key Takeaways
- Total Returns are Balancing: Over 30 years, Total Timberland returns have seen an equal contribution from EBITDDA (3.4%) and Appreciation (3.4%).
- South’s Appreciation Edge: While the South has the lowest 30-year EBITDDA (2.8%), it boasts the highest 30-year Appreciation (3.8%), suggesting that value growth in the region has outpaced cash yield.
- Northwest’s Cash Dominance: The Northwest continues to be the most efficient region for generating operational cash flow, maintaining a 3.2% EBITDDA even in the more recent 15-year window.
As we move into 2026, the challenge for timberland investors remains navigating a low-yield environment where the “quiet” growth of biological assets carries more of the heavy lifting for total returns.
This can be interpeted to mean that timber and timberlands are reverting to their historic role as suppliers to the wood manufacturing process rather than aa a value creating resource in themselves. That latter investment notion, as popularized by Sir James Goldsmith in the last decades of the Twentieth Century, may be over for the sophisticated investor.
Three trends are driving this transitional change in the value-creating process in favor of the log convertor, rather than the log supplier.
One, the remarkable conversion of the wood products industry to smaller and typically less costly logs. Secondly, the increasing capability to modify the resulting wood, and wood fiber, into ever more sophisticated and value-creating products. And Third, the ‘apparenent shrinkage’ of markets for the residual byproducts, thus creating a quest for an ever greater yield of primary product from this smaller log.
The three, cited here, are only three of the significant changes that are occurring to change the wood growing/wood using paradigm.
Richard F. (Dick) Baldwin PhD
dbaldwin@ocinvest.com