
Introduction
In December 2011, Forisk asked a simple question: how do timberland investment returns stack up against 10-year U.S. Treasuries, the classic “risk-free” benchmark? The answer then proved reassuring: over the 2001–2010 window, timberland investment vehicles, public and private, outperformed Treasuries. But conditions change, and fifteen years later, it’s worth asking the question again.
In June, we analyzed the drivers of timberland performance by comparing appreciation returns to EBITDDA returns (NCREIF’s term for the pure cash-yield component) for the NCREIF Timberland index. That post highlighted a steady decline in EBITDDA returns, particularly since 2006/2007. One explanation: delayed harvests during the Great Recession (lower harvests mean less volume and cash flows) led to an oversupply of timber later, depressing stumpage prices when housing markets returned and, in turn, lowered revenue from timber sales. Research for our Q3 2026 FRQ feature article supports this hypothesis, showing a significant accumulation of timber supplies across the South, effectively anchoring the national index and therefore suggestive of a structural shift.
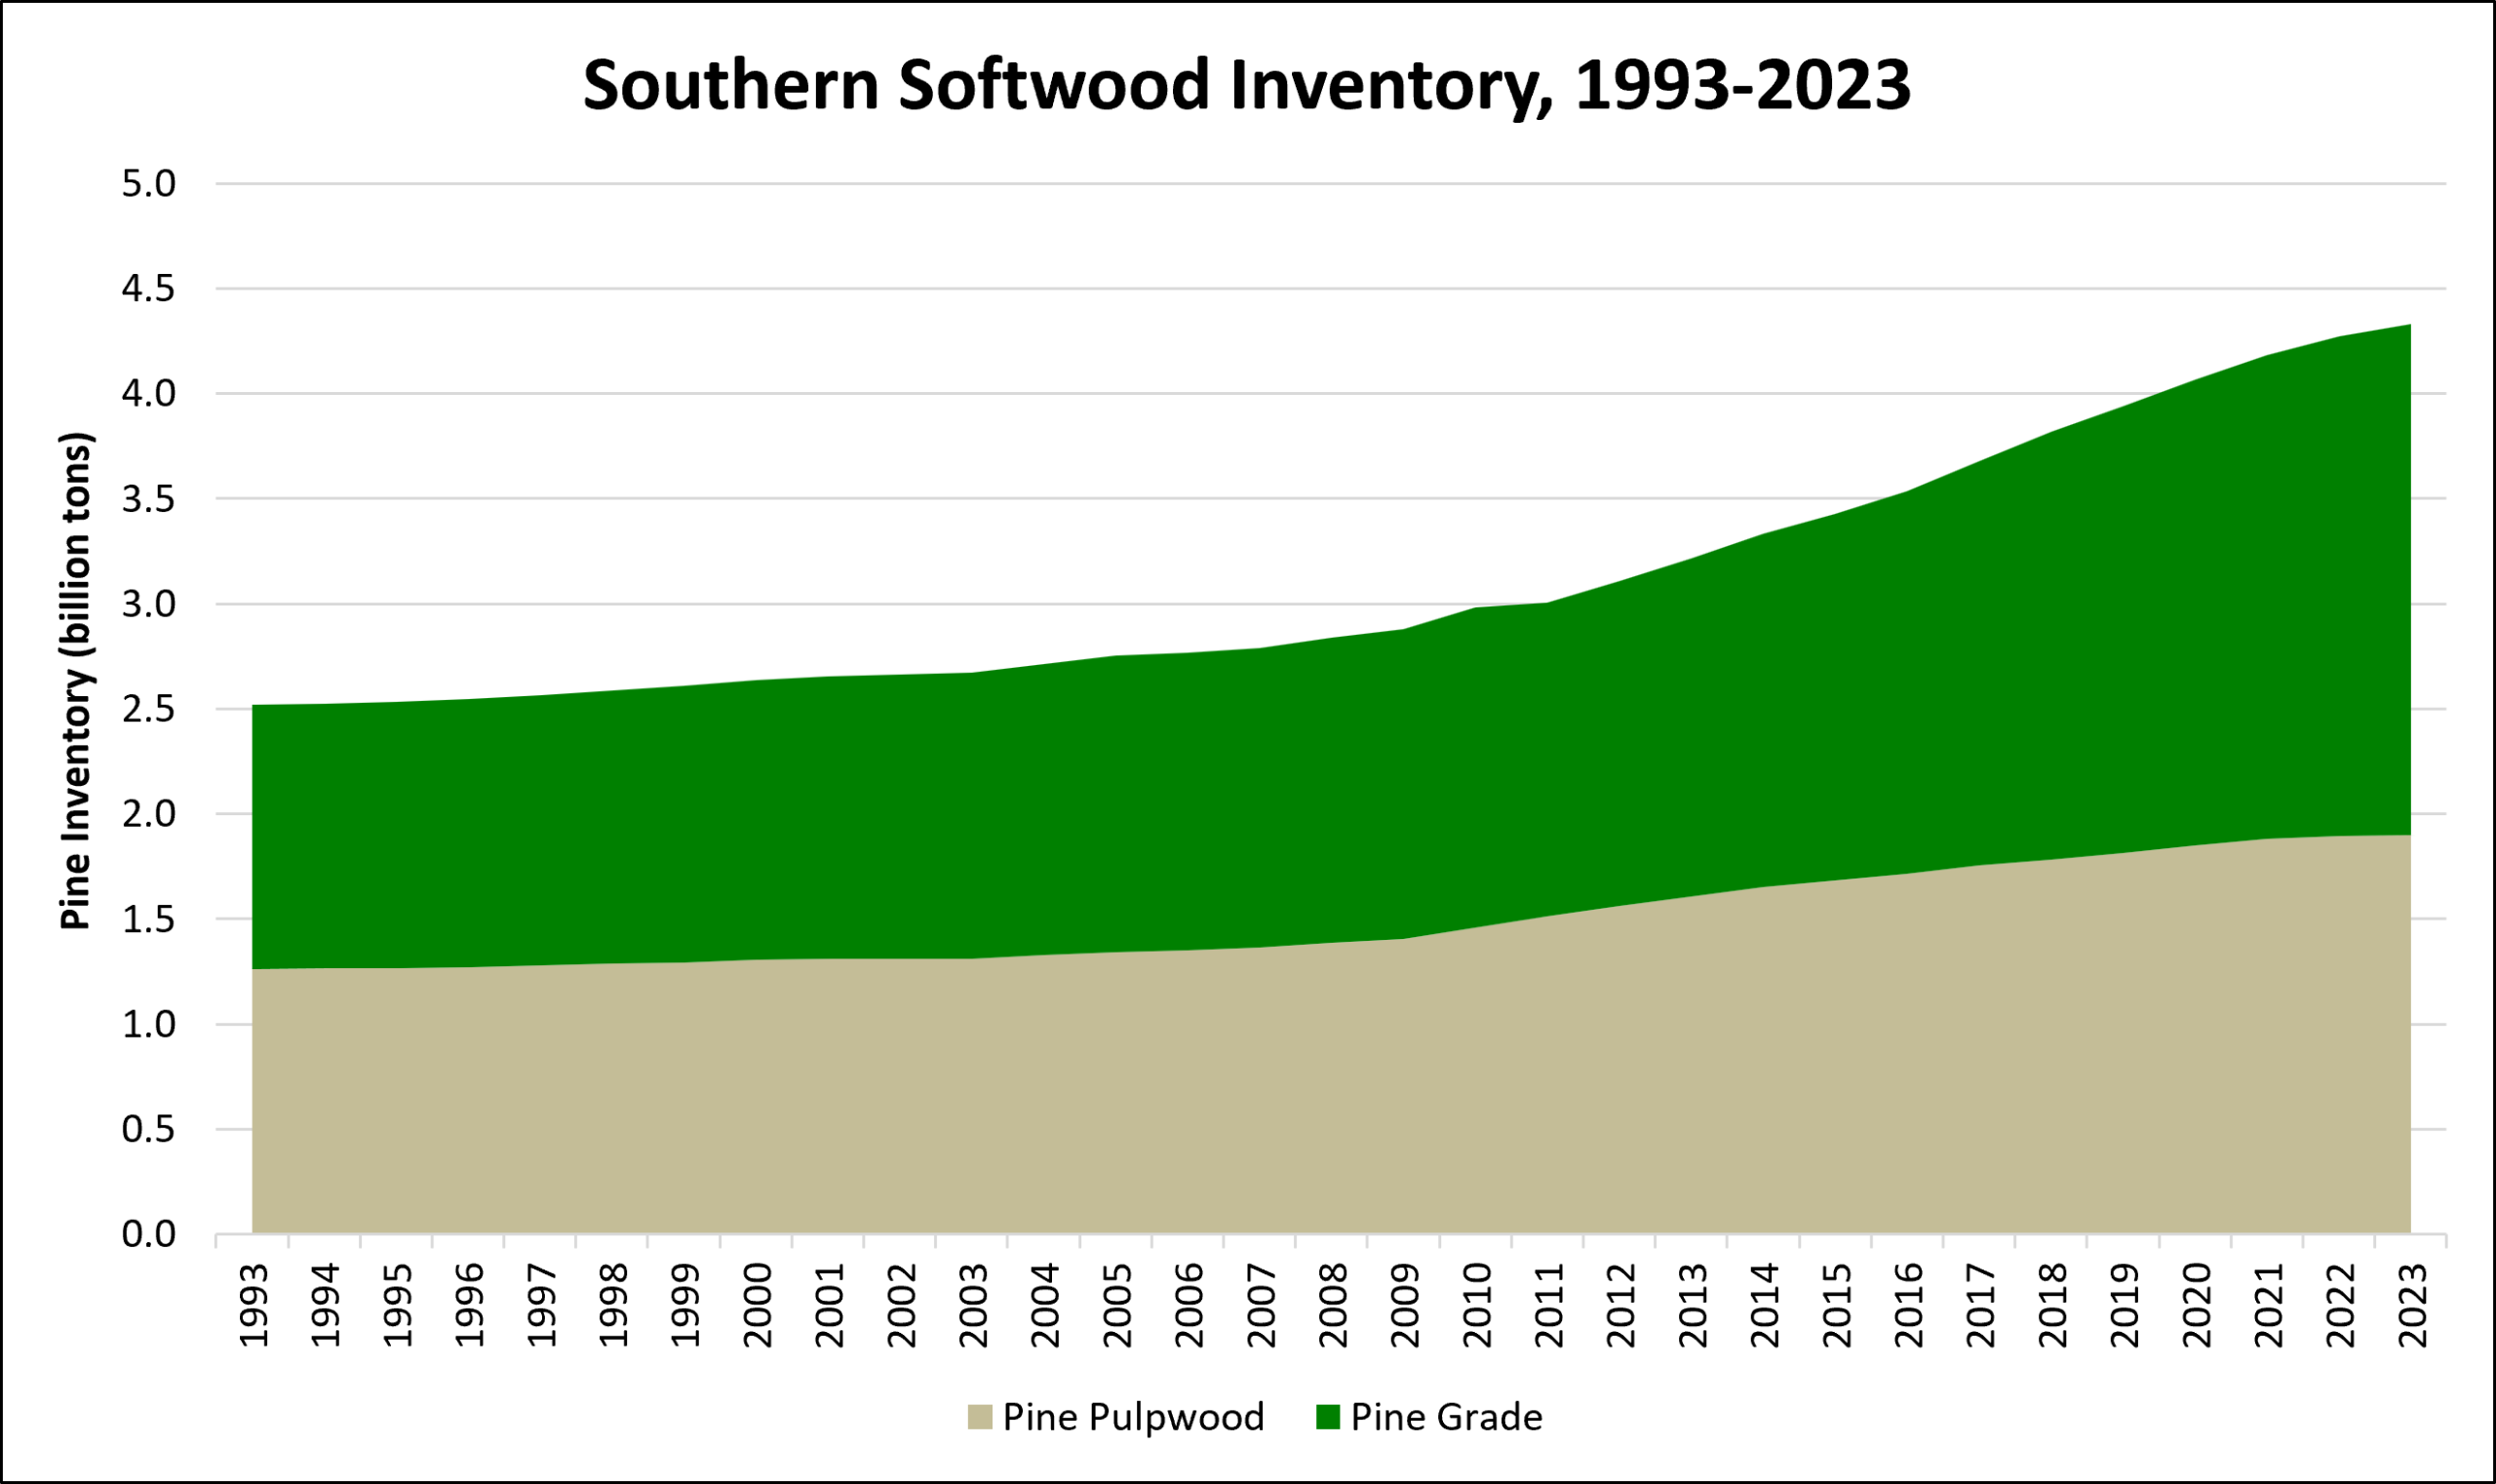
Figure 1: Southern Softwood inventory, 1993-2023
Source: U.S. Forest Service
U.S. Treasuries as Benchmarks for Timberland Investments
So how does this relate to U.S. Treasuries? Historically, timberland’s cash yield tracked or modestly beat the yield on Treasury notes, offering timberland a unique investment profile: comparable income streams with the added benefits of diversification and inflation-hedging. That case is now hard to make.
Timberland in 2025 produced an EBITDDA of 1.65% while Treasuries averaged a yield of 4.29% yield, resulting in a 2.64% delta, the widest gap in the history of the index. Recently, as the U.S. debt grows, interest rates and Treasuries have continued to climb since, recently topping 5%, while NCREIF’s trailing four-quarter EBITDDA return fell further, to 1.55%, as of Q2 2026.
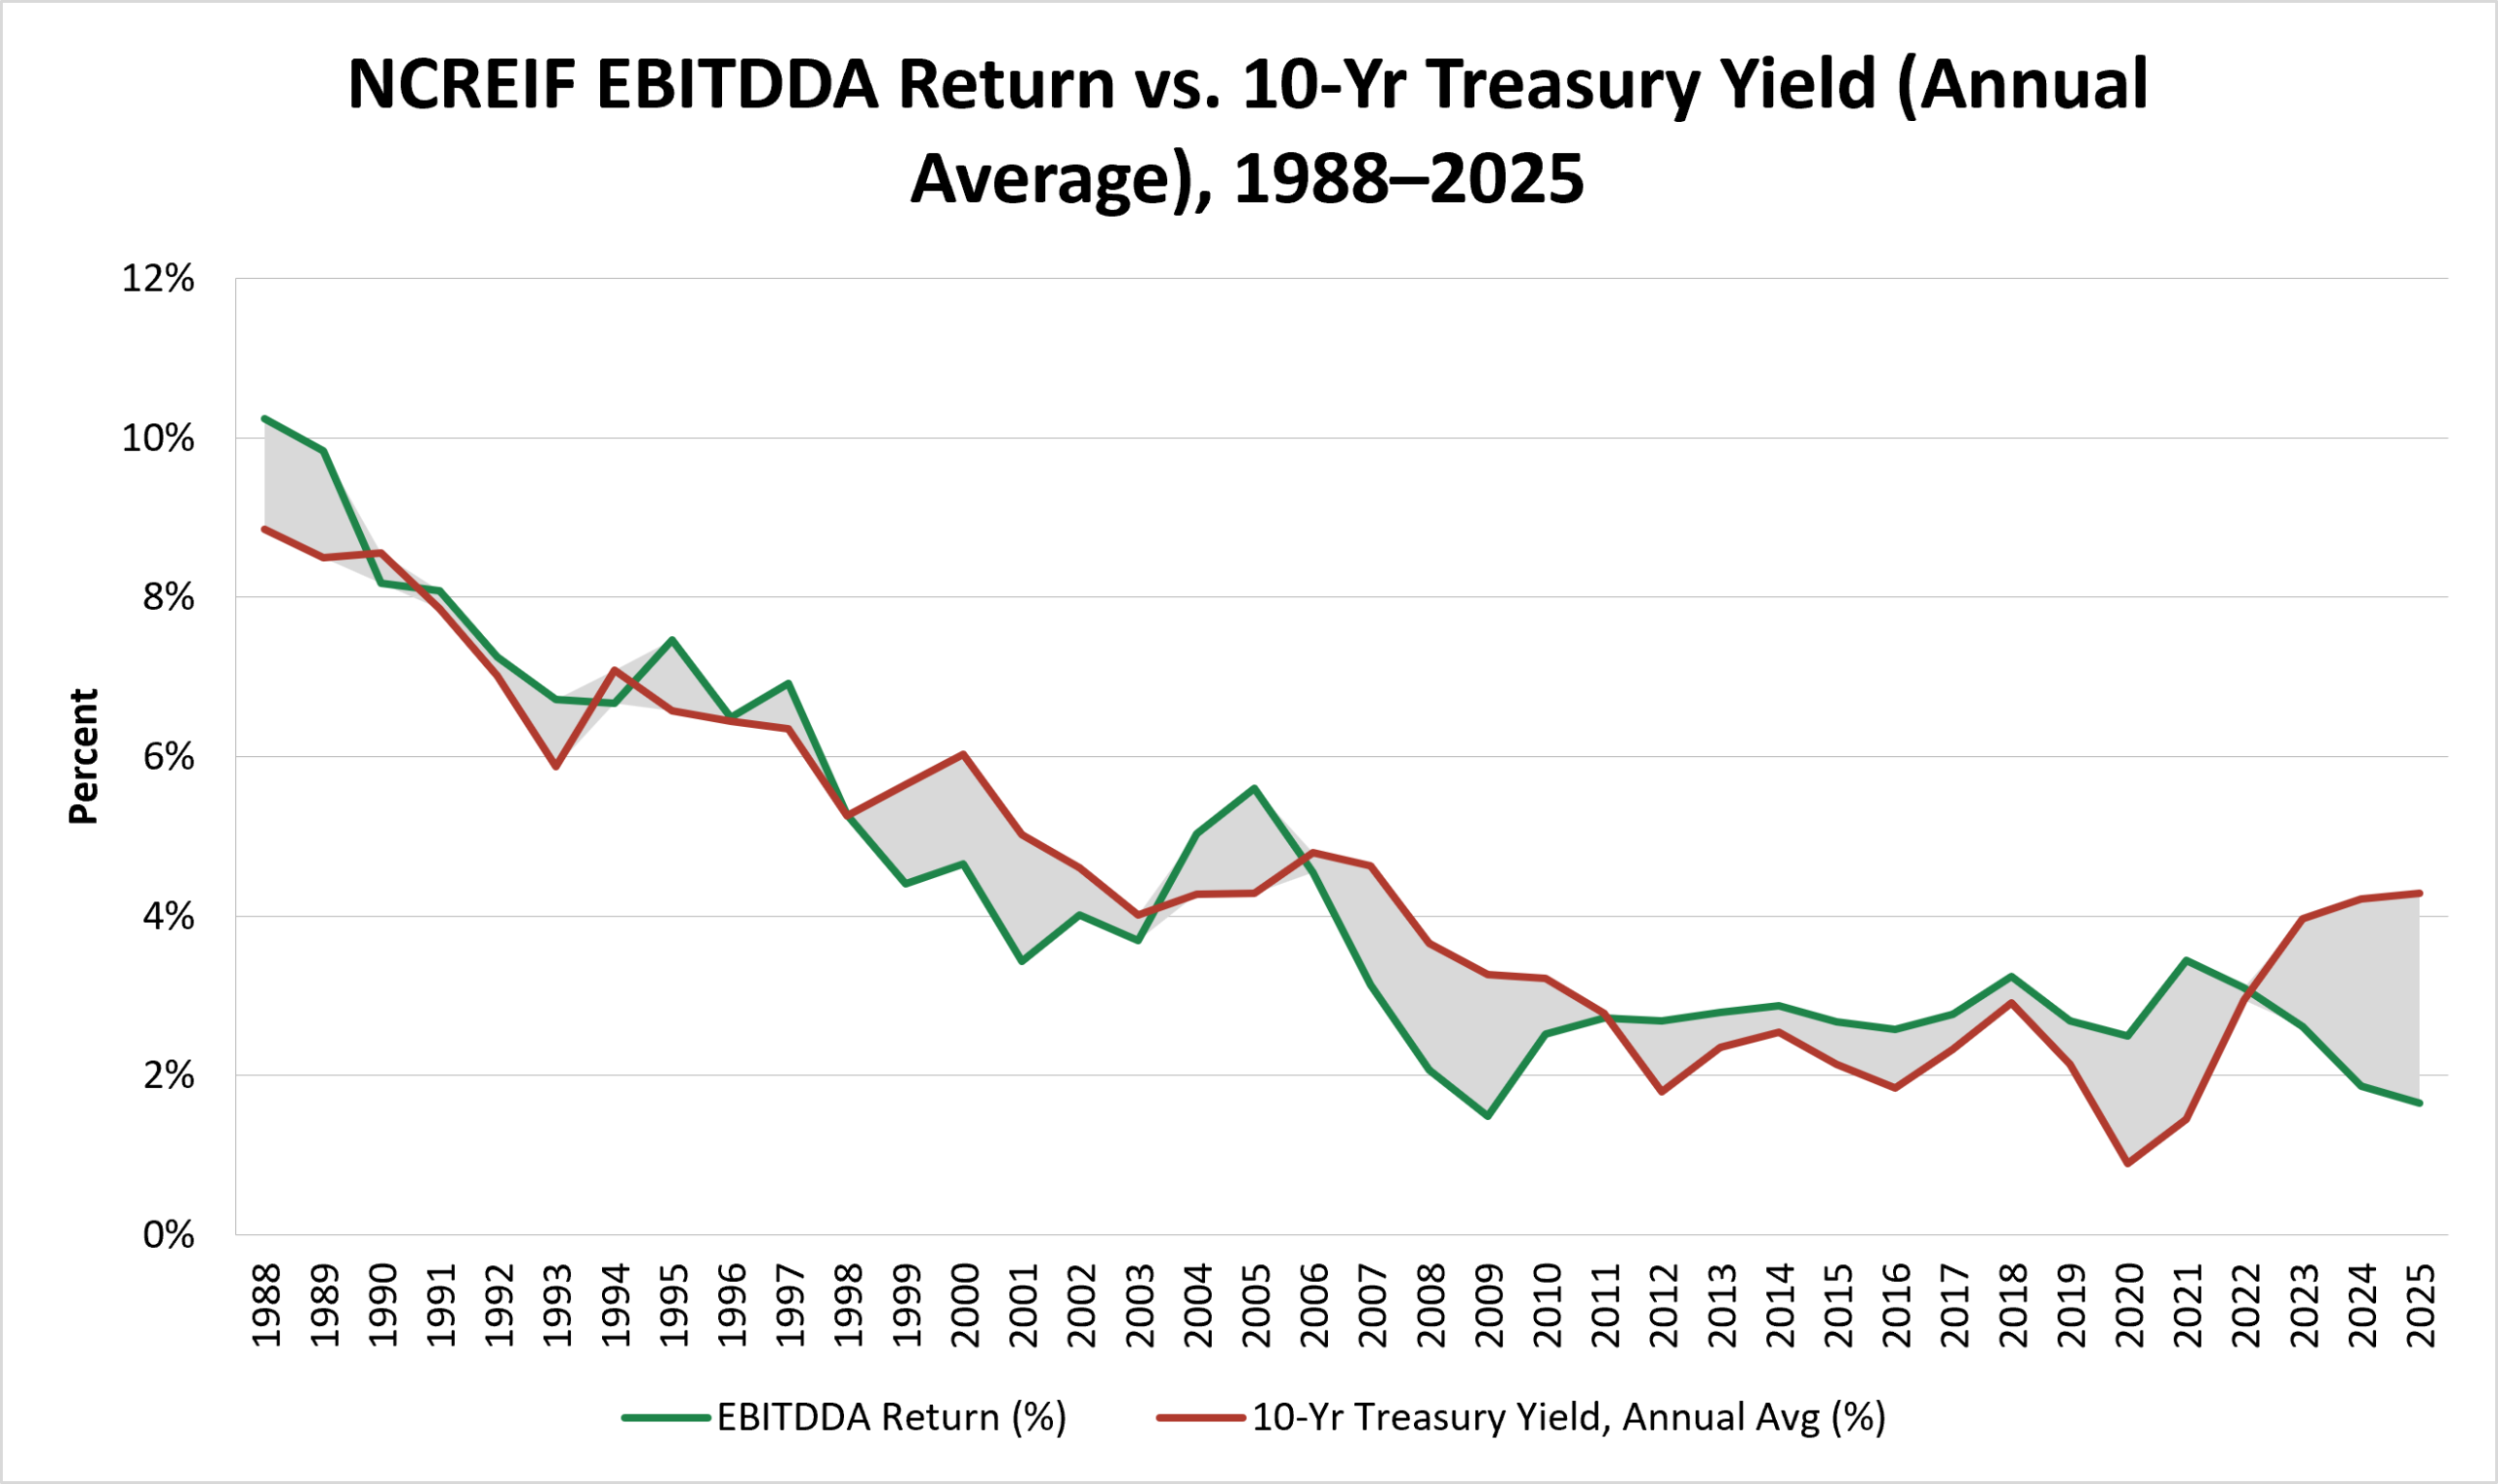
Figure 2: NCREIF EBITDDA Return vs. 10-Yr Treasury Yield (Annual Average), 1988–2025
Source: NCREIF Timberland Index; FRED (RIFLGFCY10NA)
Conclusions
Timberland has been through structural shifts before. The post Great Recession inventory buildup described earlier is one example. The current widening gap with Treasury yields may be another. Whether it reverts to historic norms or marks a lasting change, this relationship is worth watching closely.
To learn more about the Forisk Research Quarterly or Custom Market Forecasts, contact Nick DiLuzio (ndiluzio@forisk.com).
Leave a Reply